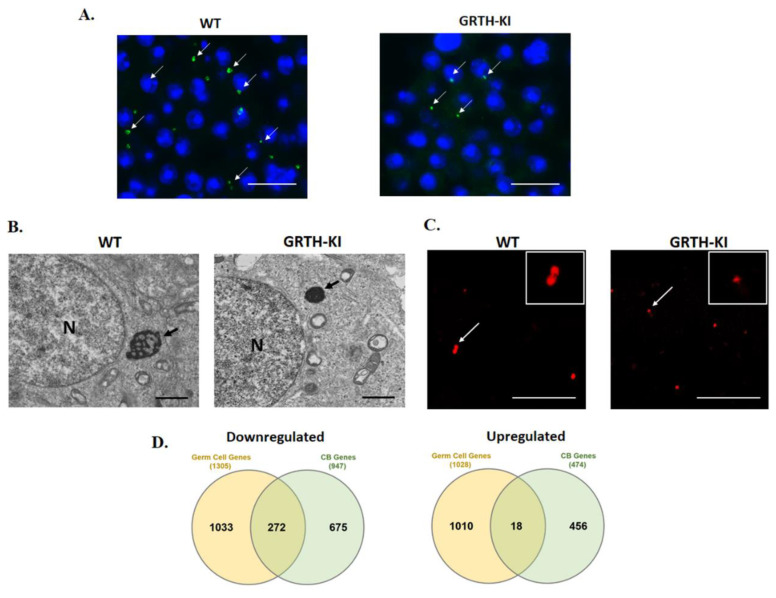
Figure 4.
Cellular and transcriptomic changes occurring in CBs of GRTH-KI mice compared to wild-type mice. (A) Immunofluorescence staining of MVH/DDX4 (green) in the testicular tissue sections of WT and KI mice, CBs indicated by arrow; scale bar: ~25 μm [10]. (B) EM images from testicular sections with round spermatids (RS) showing a lobular structure with an irregular network of the less dense strands characteristic of the CB clearly visible in WT, while in GRTH-KI, CB is markedly reduced in size. Arrows indicate CBs and N-Nucleus; scale bar: ~1 μm [10]. (C) Immunofluorescence staining of MVH/DDX4 as a marker showing CBs (red) isolated from GRTH-KI mice are smaller in size compared to WT. Inset shows detail of CBs indicated by arrow; scale bar: ~25 μm [10]. (D) Comparison of gene expression of downregulated/upregulated genes in germ cells with a decrease/increase in the abundance of genes in CB obtained from wild-type and GRTH-KI mice [10]. Detailed methodology on immunofluorescence, EM, and RNA-Seq analysis were described earlier [10].

