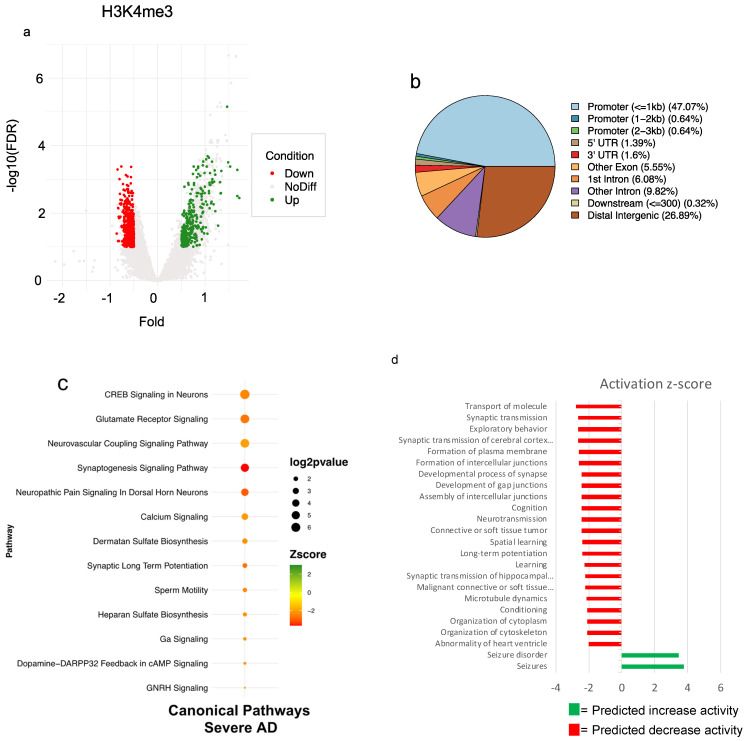
Figure 4.
Differential analysis of H3K4me3 profiles identifies the downregulation of several pathways related to AD. (a) Volcano plot showing H3K4me3 depleted (in red) and enriched regions (in green) identified by differential analysis. (b) Pie-chart showing the annotation of 937 DE site of H3K4me3. (c) IPA-identified pathway using all H3K4me3 DE sites previously annotated as promoters. (d) IPA function and disease results obtained using all H3K4me3 DE sites previously annotated as promoters. Results show that severe AD patients are characterized by modulation of H4K4me3 signal on promoters of genes encoding for proteins involved in several pathways linked to brain function.

