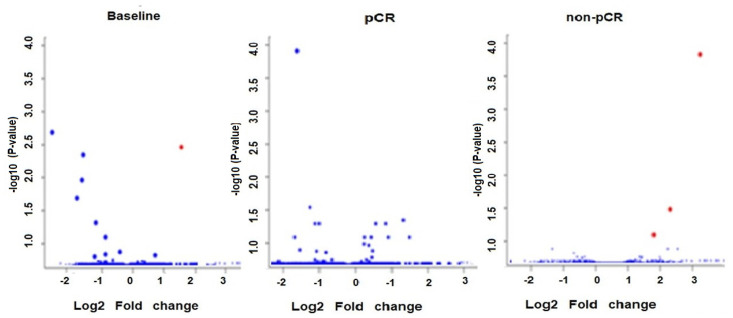
Figure 2.
Volcano plot of circulating exo-miRs at baseline in pCR versus non-pCR and after the first NACT dose compared to baseline in the groups of patients with pCR and non-pCR. The plot is constructed by plotting the FDR corrected negative log10 (p-value) on the y-axis and the expression fold change between the two experimental groups on the x-axis. The larger the difference in expression of a feature, the more extreme its point will lie on the x-axis. The more significant the difference, the smaller the p-value and thus the higher the −log10 (p) value. Thus, points for features with highly significant differences will lie high in the plot. Features of interest are typically those which change significantly and by a certain magnitude. These are the points in the upper left and upper right-hand parts of the volcano plot. Red dots show upregulated miRNAs and blue dots show downregulated miRNAs.

