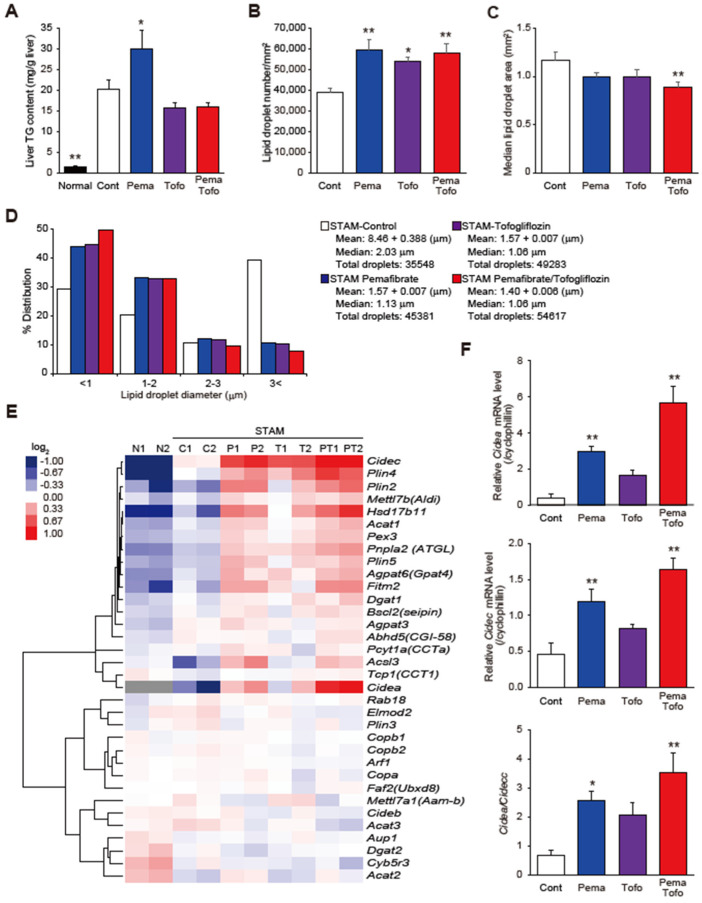
Figure 3.
Pemafibrate and Tofogliflozin combination induces lipid droplets formation. (A) Liver TG content, (B) Lipid droplet number, (C) Median lipid droplet, (D) Lipid droplet sizes distribution, (E) Heatmap of hierarchical clustering of LDAPs and formation-related genes, and (F) Cidea, Cidec, and Cidea/Cidec ratio of control, pemafibrate, tofogliflozin, and pemafibrate and tofogliflozin combination-treated STAM mice. * p < 0.05; ** p < 0.01: Significantly difference from STAM control group by Dunnett’s multiple comparison test.

