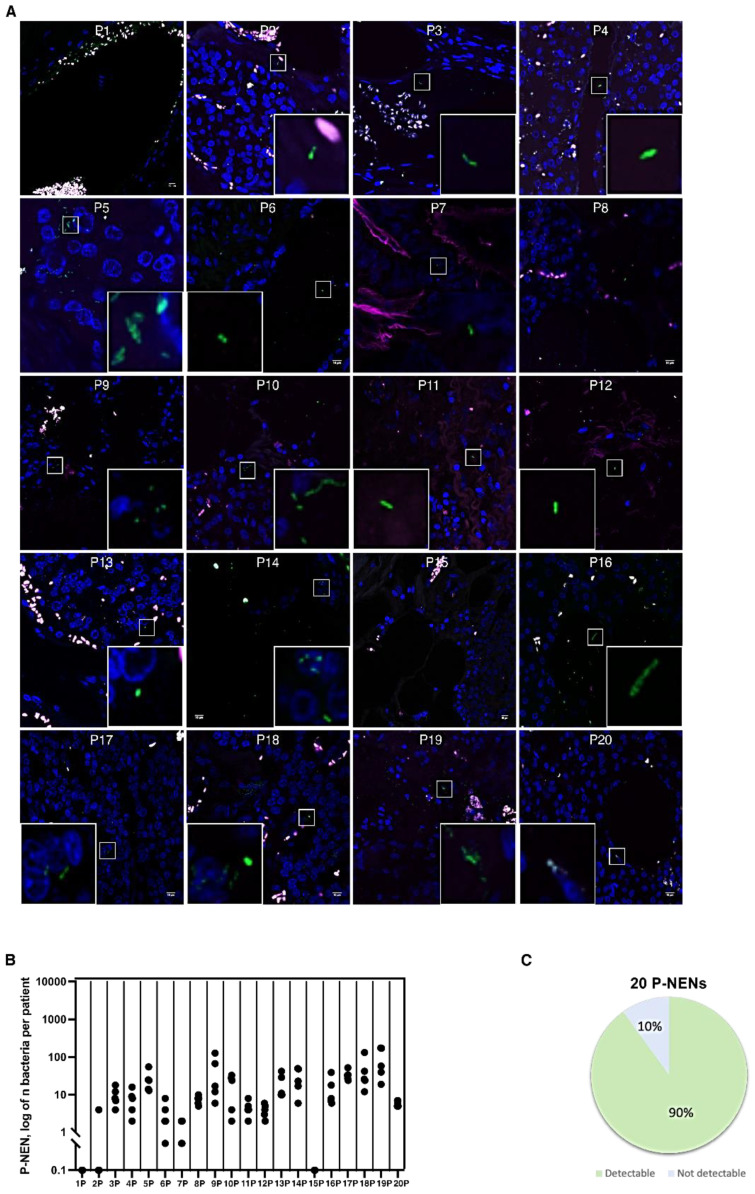
Figure 2.
Bacterial count in pan-NEN patients. (A) Representative confocal microscopy images of the bacterial signal observed within pan-NEN patients (N = 18). Scale bar = 10 µm. (B) Dot plot representing the log10 normalized bacterial counts per acquired section (N = 5) by FISH in pan-NEN specimens (N = 20). (C) Distribution of bacterial occurrence in pan-NEN patients (N = 20).

