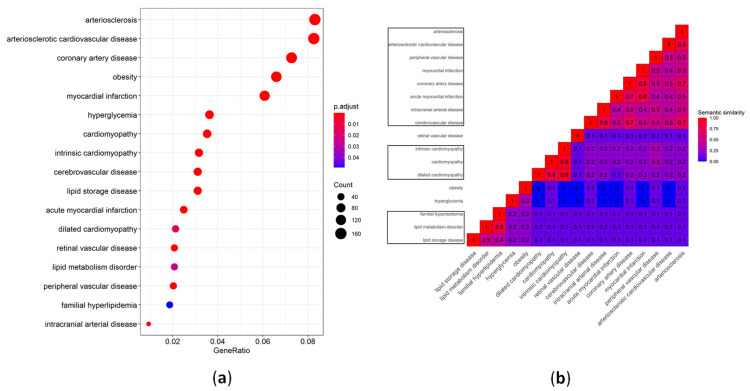
Figure 1.
Selected CVD-associated DOSE terms that are enriched in the validated gene targets of CVD-associated miRNAs. (a) Dot plot of statistically significant, CVD-associated DOSE terms, displaying the gene ratio and statistical significance (p-value < 0.05, following Bonferroni adjustment). (b) Heat map displaying the semantic similarity between the CVD-associated DOSE terms. The DOSE term similarity measurements were performed using the method of Wang et al. [57] and clusterProfiler [55,56]. The DOSE terms were clustered using hierarchical clustering. Clusters with two or more terms are specified with black-colored borders. The heat map was created using ComplexHeatmap [58].

