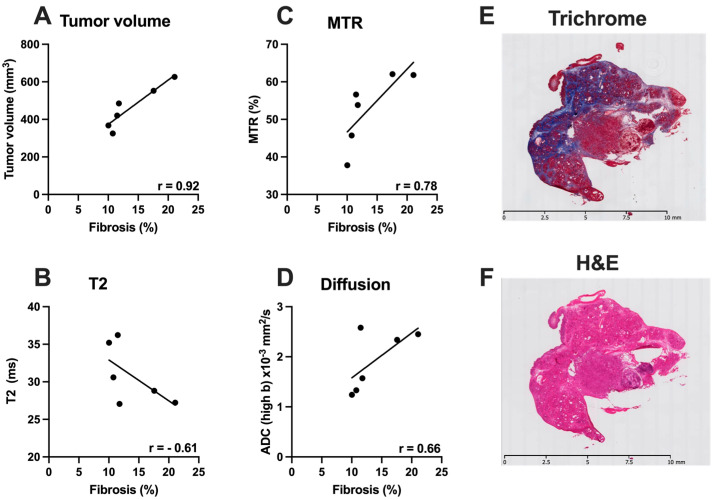
Figure 4.
Relationship between MR and histological parameters in the advanced stages of PDAC. (A) showing relationship between Tumor volume (mm3) and Fibrosis (%); (B) showing relationship between T2 (ms) and Fibrosis (%); (C) relationship between MTR (%) and Fibrosis (%); (D) ADC low b (×10−3 mm2/s) and Fibrosis (%); (E,F) Representative images of Masson’s Trichrome and H&E stained tumor.

