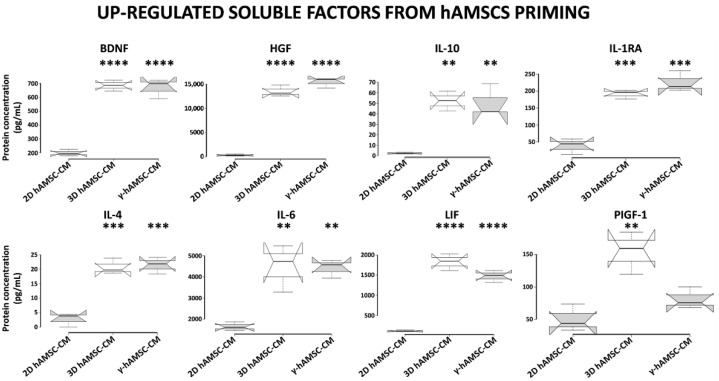
Figure 6.
Secretion of functional factors in conditioned medium (CM) derived from two-dimensional (2D hAMSC-CM), three-dimensional (3D hAMSC-CM) and IFN-γ-treated (γ-hAMSC-CM) hAMSC cultures. The CM was collected after 48 h of culture. The concentrations of each factor were determined by multiplex-microbead immunoassay. Box plots of three independent experiments are displayed, where the horizontal bar represents the median, the box represents the interquartile range (IQR) and the whiskers represent the maximum and minimum values. Comparisons made by Dunnet’s t-tests. ** = p < 0.005; *** = p < 0.0005; **** = p < 0.0001 compared with 2D hAMSC-CM.

