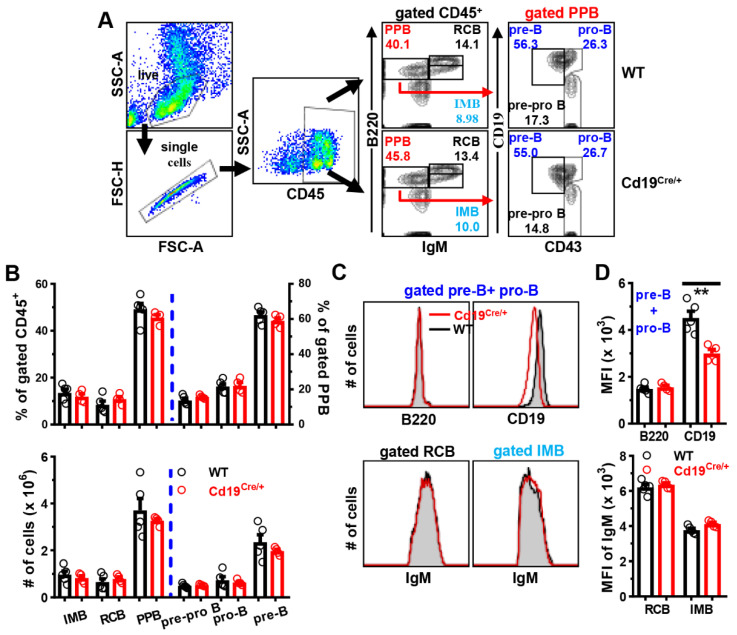
Figure 1.
Comparable B cell development in the BM between WT and Cd19Cre/+mice. BM mononuclear cells were isolated from the femur of mice, and stained with antibodies against CD45/B220/IgM/CD19 and CD43, followed by analyses on FACS. (A) Representative FACS plots showing the gating strategies for pre/pro (PPB, B220lowIgM−), re-circulating (RCB, B220highIgM+), and immature (IMB, B220lowIgM+) B cells within gated CD45+ BM cells, or pre-B (CD19+CD43−), pro-B (CD19+CD43+) and pre-pro B (CD19−CD43+) cells in gated BM PPB cells between WT and Cd19Cre/+ mice. (B) Bar graphs showing the percentages (upper panel) or absolute numbers (lower panel) of indicated B cell subsets. (C) Representative overlayed histograms showing surface expression levels of B220 (upper left)/CD19 (upper right) on gated CD19+ pre-B plus pro-B cells, or IgM on gated RCB (lower left)/IMB (lower right) cells in WT (black line) and Cd19Cre/+ (red line) mice. (D) Bar graphs showing the mean fluorescence intensity (MFI) of B220/CD19 on gated CD19+ pre-B plus pro-B cells (upper panel) or IgM on gated RCB/IMB cells in the two groups of mice (female, 8–10 weeks of age; n = 5/4 for WT/Cd19Cre/+ group, respectively). Each symbol represents one single mouse, and results are expressed as mean ± SEM (B,D). ** p < 0.01.

