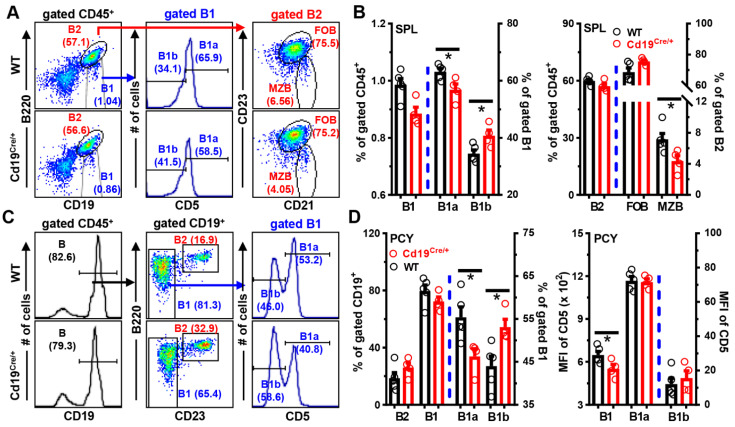
Figure 2.
Mildly disturbed phenotypes of B cells in the periphery of Cd19Cre/+mice. Cells from the spleens (SPL) or peritoneal cavities (PCY) of mice were stained with antibodies against CD45/B220/CD19/CD5/CD21 and CD23, followed by analyses on FACS. (A,C) Representative FACS plots/histograms showing the gating strategies and percentages of B2 (CD19+B220high in SPL or CD19+B220highCD23+ in PCY), B1 (CD19+B220low in SPL or CD19+B220lowCD23− in PCY), B1a/b (CD5+/CD5−, respectively), follicular (FOB, CD19+B220highCD23highCD21low), and marginzal zone (MZB, CD19+B220highCD23lowCD21high) B cells within gated CD45+ cells in the SPL (A) or PCY (C) of WT and Cd19Cre/+ mice. (B) Bar graphs showing the percentages of B1/B2 within gated CD45+ cells, B1a/B1b within gated B1, or FOB/MZB within gated B2 cells in the SPL. (D) Bar graphs showing the percentages of indicated B cell subsets (left), or the MFI of CD5 on gated B1, B1a, or B1b cells (right) in the PCY of the two groups of mice. Each symbol represents one single mouse, and results are expressed as mean ± SEM (B,D). * p < 0.05.

