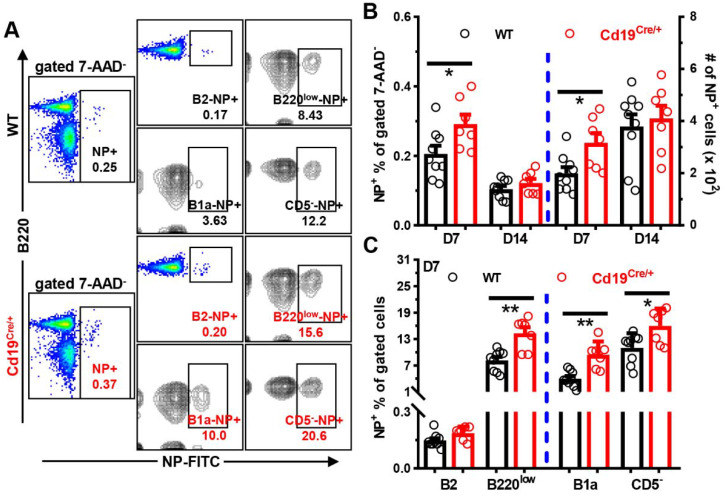
Figure 4.
Increased numbers of NP+ B cells in circulations of Cd19Cre/+mice immunized with NP-Ficoll. Mice (male, ~12 weeks old) were immunized as described in the legend to Figure 3. Cells in tail blood on D7 and D14 after immunization were stained with 7-AAD and NP-FITC plus antibodies against B220/CD19/CD5. (A) Representative FACS plots showing the percentages of NP+ cells within gated live 7-AAD− (NP+), CD19+B220high B2 (B2-NP+), CD19+B220low (B220low-NP+), CD19+B220lowCD5+ B1a (B1a-NP+), and CD19+B220lowCD5− (CD5−-NP+) B cells in WT vs. Cd19Cre/+ mice on D7. Gates for CD19+B220low/CD19+B220lowCD5− cells were equivalent to those for B1/B1b in Supplementary Figure S3A, respectively. (B) A bar graph showing the percentages or numbers (per 40 μL blood) of total NP+ cells within gated 7-AAD− live cells on D7 and D14. (C) A bar graph showing the percentages of NP+ cells within gated B2, B220low or B1a/B220lowCD5− cells in the two groups of mice on D7 (n = 9/7 for WT/Cd19Cre/+ group, respectively). Each symbol represents one single mouse of the indicated genotype, and results are expressed as mean ± SEM (B,C). * p < 0.05; ** p < 0.01.

