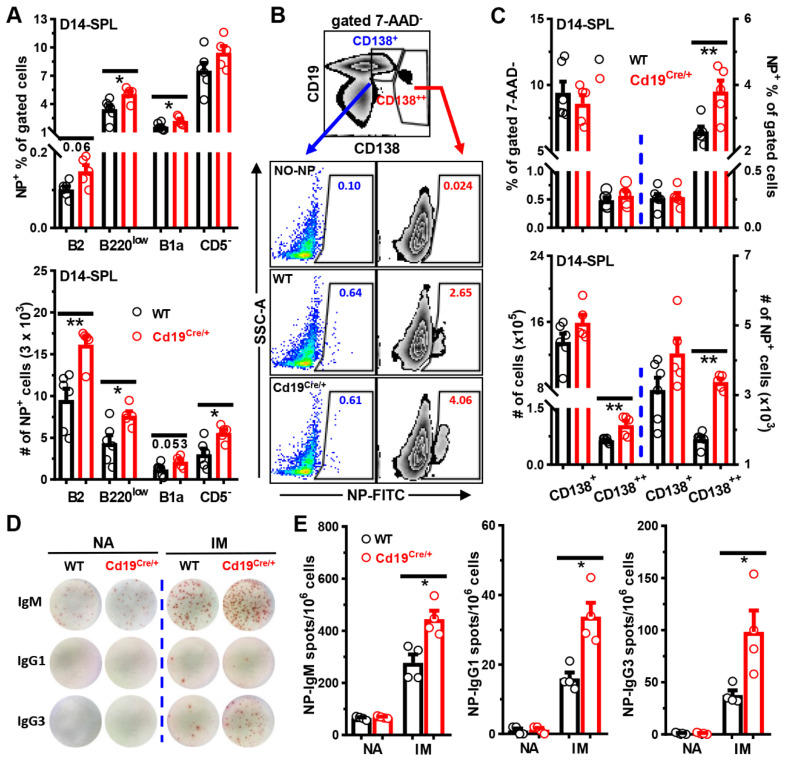
Figure 5.
Increased numbers of NP+ B cells in spleens of Cd19Cre/+mice immunized with NP-Ficoll. Mice were immunized as described in the legend to Figure 3. Cells in spleens (SPL) on D14 after immunization were stained with 7-AAD, NP-FITC plus antibodies against B220/CD19/CD5 and CD138 (A–C) or cultured on NP25-BSA-coated PVDF membranes for ELISPOT analysis (D,E). (A) Bar graphs showing the percentages (upper panel) and numbers (lower panel) of NP+ cells within gated B2 (CD19+B220high), B220low (CD19+B220low), B1a (CD19+B220lowCD5+), and CD5−(CD19+B220lowCD5−) B cells in WT vs. Cd19Cre/+ mice. Gates for CD19+B220low/CD19+B220lowCD5− cells were the same as those for B1/B1b in Figure 2A, respectively. (B) Representative FACS plots showing the gating strategies for CD19+CD138low (CD138+), CD19lowCD138high (CD138++) or the percentages of NP+ within gated CD138+/CD138++ cells in WT vs. Cd19Cre/+ mice. A sample stained with all the antibodies but without NP-FITC (NO-NP, 2nd row) served as the negative control. (C) Bar graphs showing the percentages (upper panel) and numbers (lower panel) of CD138+/CD138++ cells or NP+ cells within gated CD138+/CD138++ populations in the two groups of mice. (D,E) Representative pictures (D) or bar graphs (E) showing the numbers of NP-specific spots in spleens of naive (NA) and immunized (IM) WT vs. Cd19Cre/+ mice. Each symbol represents one single male mouse of the indicated genotype, and results are expressed as mean ± SEM (A,C,E). * p < 0.05; ** p < 0.01.

