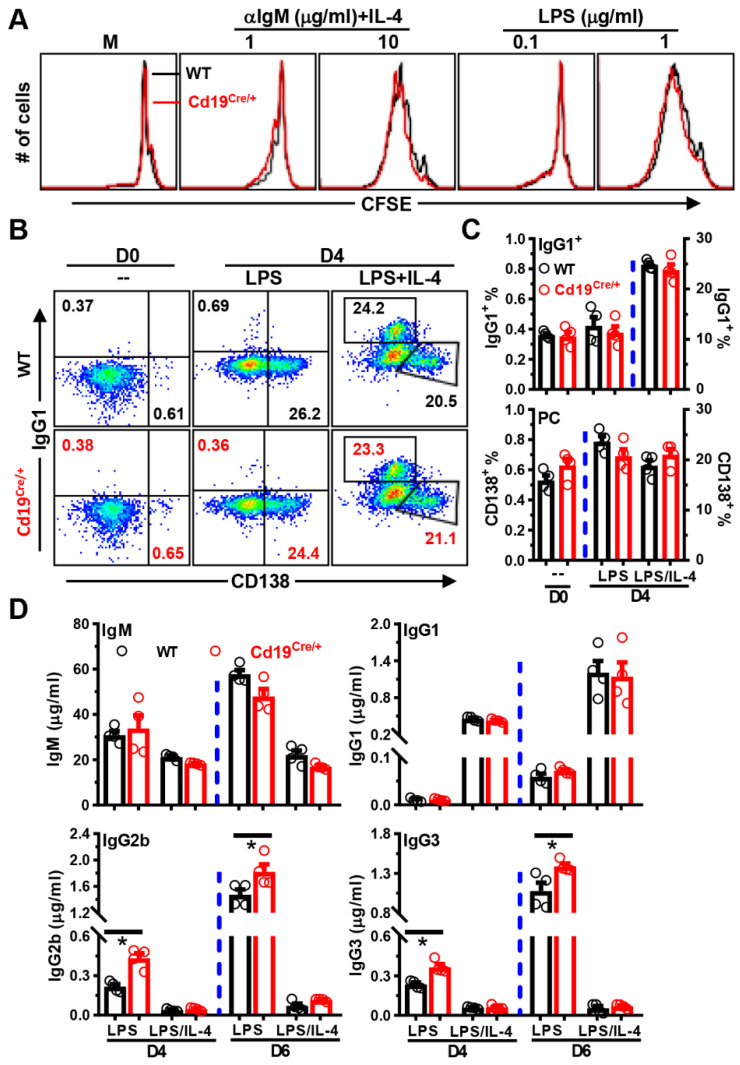
Figure 7.
Enhanced IgG2b and IgG3 productions of Cd19Cre/+B cells after stimulation with LPS in vitro. (A) Representative overlayed histograms showing the CFSE profiles of gated CD19+ cells in different culture conditions on day 4. Splenic cells (3 × 10⁵/well) from WT or Cd19Cre/+ mice were labeled with CFSE, and then stimulated with medium (M), LPS (0.1/1 μg/mL) or anti-IgM (αIgM, 1/10 μg/mL) plus IL-4 (20 ng/mL) in 96 U-bottom plates. (B) Representative FACS plots showing surface CD138 vs. IgG1 expressions on B cells before (D0) or after stimulation with LPS ± IL-4 for 4 days (D4). (C) Bar graphs showing percentages of IgG1+CD138− (IgG1+) or IgG1−CD138+ plasma cells (CD138+, PC) on D0 or D4. (D) Bar graphs showing the levels of IgM/IgG1/IgG2b and IgG3 in supernatants collected on day 4 or 6. Purified CD19+ B cells (5 × 10⁴/well) were cultured with LPS (10 μg/mL) ± IL-4 (25 ng/mL) in 96 U-bottom plates (B–D). Each symbol represents one single mouse of the indicated genotype (female, 8–10 weeks of age, n = 4 for each group), and results are expressed as mean ± SEM (C,D). * p < 0.05.

