Figure 1.
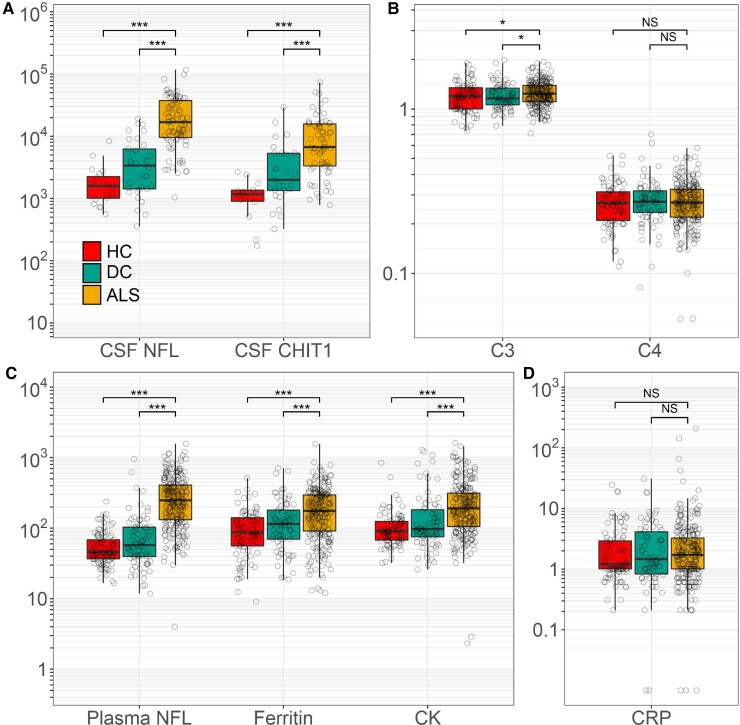
Cross-sectional biomarker levels. (A) Cross-sectional levels of CSF NFL and CHIT1 (pg/ml). CSF levels of NFL and CHIT1 were elevated in the first-visit CSF samples of ALS patients compared with healthy (NFL P < 0.0001, CHIT1 P < 0.0001) and disease controls (NFL P < 0.0001, CHIT1 P < 0.0001). (C) Cross-sectional levels of plasma NFL (pg/ml), serum ferritin (μg/L), plasma CK (IU/l) and serum C3 (g/l) were elevated in the first-visit CSF samples of ALS patients compared with healthy (for NFL P < 0.0001, ferritin P < 0.0001, CK P < 0.0001, C3) and disease controls (NFL P < 0.0001, ferritin P = 0.003, CK P < 0.001, C3). Serum C4 (g/l) (B) and plasma CRP (mg/l) (D) levels were similar between ALS compared with healthy controls (CRP P = 0.612, C3 P = 0.064, C4 P = 0.861) and disease controls (CRP P = 0.883, C3 P = 0.209, C4 P = 0.899). All data are displayed as median ± IQR; P-values given for ANCOVA of log-transformed analyte levels, controlling for age, sex and study site. ALS, amyotrophic lateral sclerosis; DC, disease control; HC, healthy control; NFL, neurofilament light chain; CHIT1, chitotriosidase 1; CK, creatine kinase; CRP, C-reactive protein; C3, complement C3 protein; C4, complement C4 protein. *P < 0.05; ***P < 0.001, NS, not significant.

