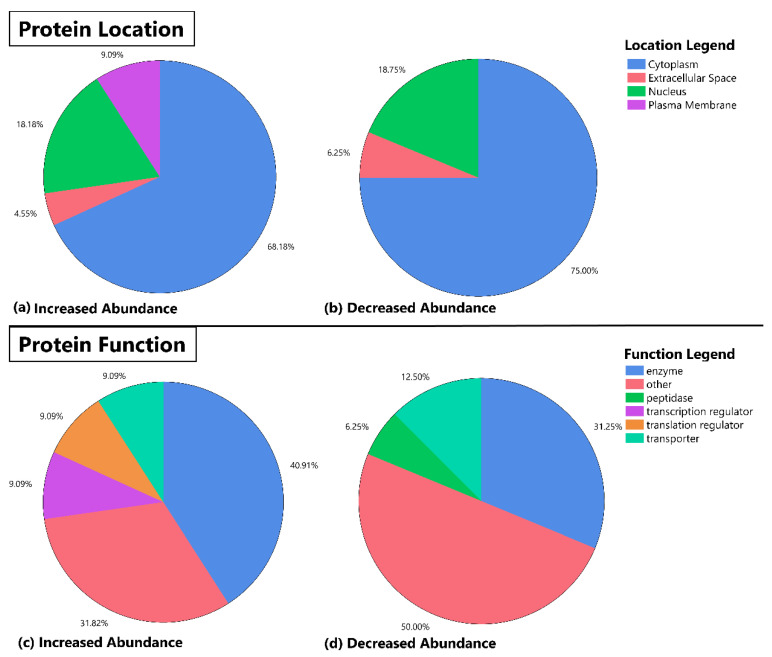
Figure 1.
Pie chart representation of protein location and function for identified protein abundance differences between patients on atypical antipsychotics (AAP) and mood stabilizers. This figure depicts the location and function (as determined by the Molecule Module of Ingenuity Pathway Analysis Software) of protein abundancies that were determined to be significantly different in the skeletal muscle of AAP-treated subjects versus mood stabilizer-treated subjects. The top half of the panel depicts protein location (a,b) and the bottom half of the panel shows the distribution of annotated function for each identified protein (c,d). The increased abundance and decreased abundance refer to increases or decreases in the AAP group relative to the mood stabilizer group.

