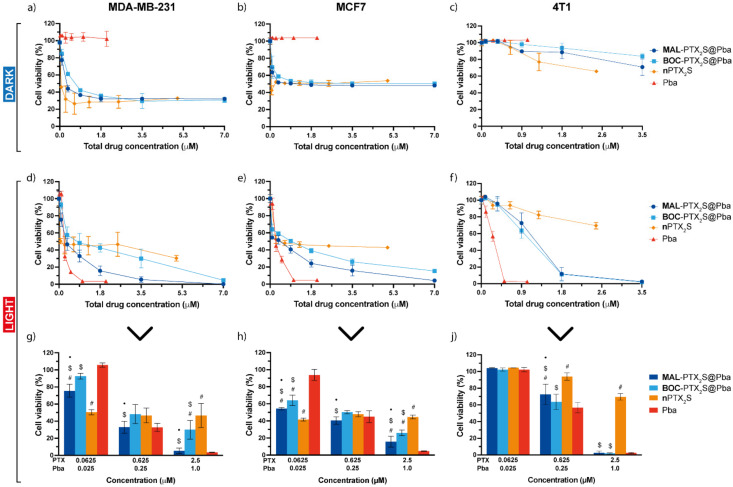
Figure 6.
In vitro mono and combination therapy on cells cultured as monolayers. MDA-MB-231 (a,d,g), MCF7 (b,e,h) and 4T1 (c,f,j) cells were incubated for 24 h with the different drugs/drug combinations and maintained in the dark (a–c) or exposed to red light (1 J/cm2) (d–f). Cell viability was assessed with the MTS assay after additional 24 (MDA-MB-231, MCF7) or 48 h (4T1) of cells release in drug-free medium. To better compare the cytotoxic effects after light exposure, some concentrations have been extrapolated from the dose-response curves: (g) for MDA-MB-231, (h) for MCF7, and (j) for 4T1 cells. Total drug concentration is referred to PTX + Pba concentration. Data are expressed as mean percentage ± SD of at least three independent experiments, carried out in triplicate. Statistical significance was calculated applying the ANOVA Two-way with Bonferroni’s correction: ● significantly different from BOC-PTX2S@Pba; # significantly different from Pba; $ significantly different from nPTX2S.

