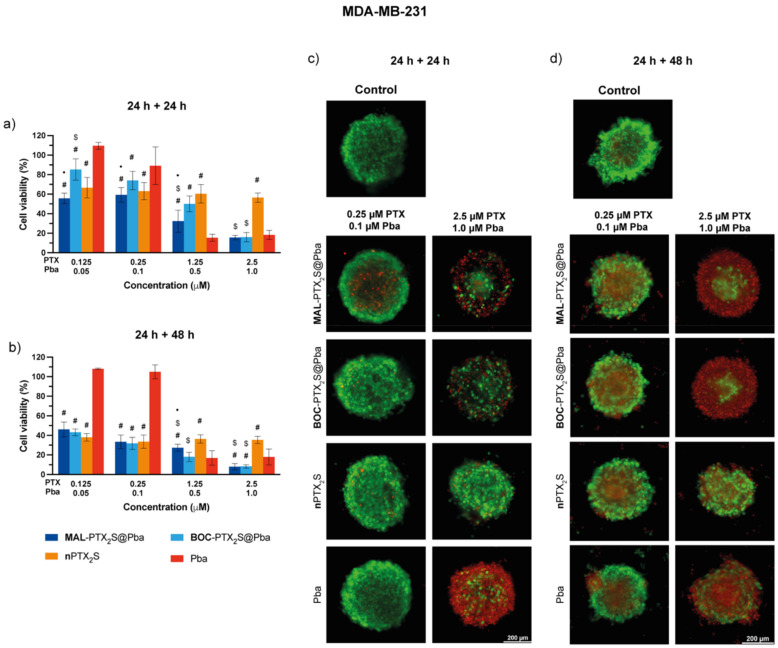
Figure 10.
In vitro mono and combination therapy in MDA-MB-231 spheroids. The spheroids were incubated with the different drugs/combinations for 24 h and then irradiated with red light (1 J/cm2); cell viability was measured by means of ATP reduction (3D Glo assay) 24 (a) or 48 h (b) post-irradiation. Data are expressed as mean percentage ± SD of at least two independent experiments, carried out in quadruplicate. Statistical significance was calculated applying the ANOVA Two-way with Bonferroni’s correction: ● significantly different from BOC-PTX2S@Pba; # significantly different from Pba; $ significantly different from nPTX2S. Selected images of spheroids stained with the LIVE/DEAD kit and acquired with a fluorescence microscope 24 (c) or 48 h (d) after irradiation. Scale bars: 200 μm.

