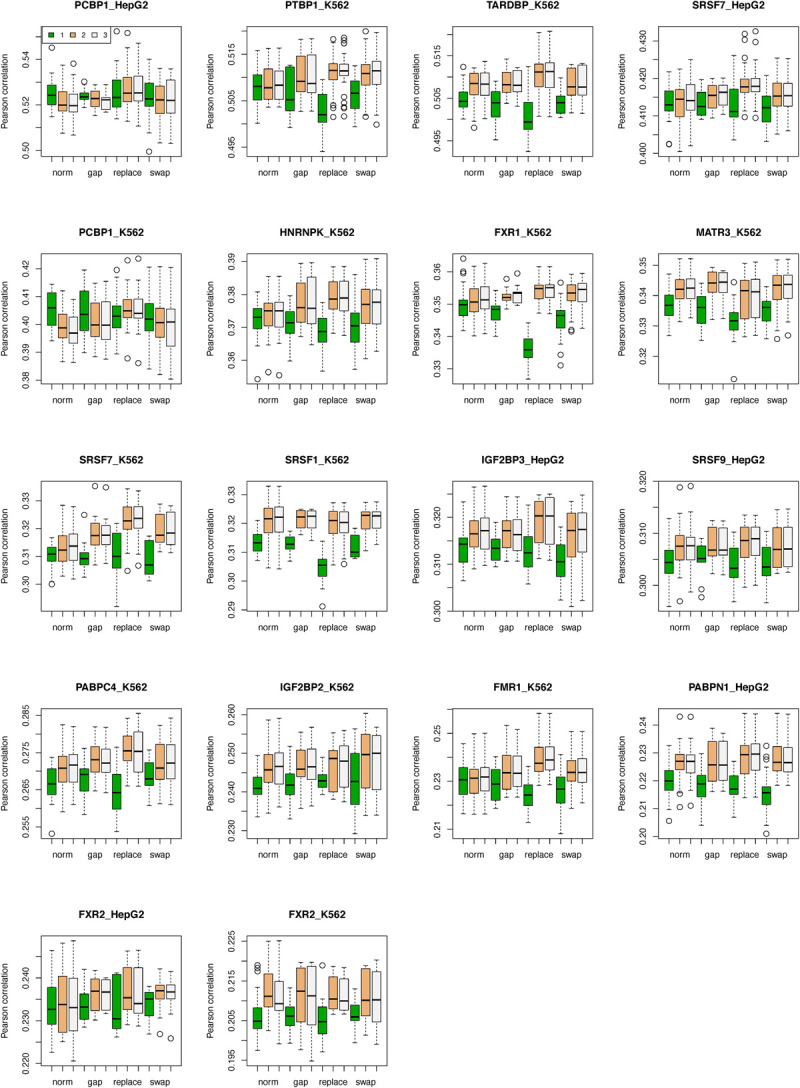
Fig 3. Performance of RBP-ADDA model after data augmentation operations.

In each panel, the predictive performances on an RBP are grouped and shown as norm (non-augment), gap, replacement, and swap. Within each group, the performances after pre-training step, domain adaptation step and fine-tuning step are indicated as “1”, “2” and “3”.
