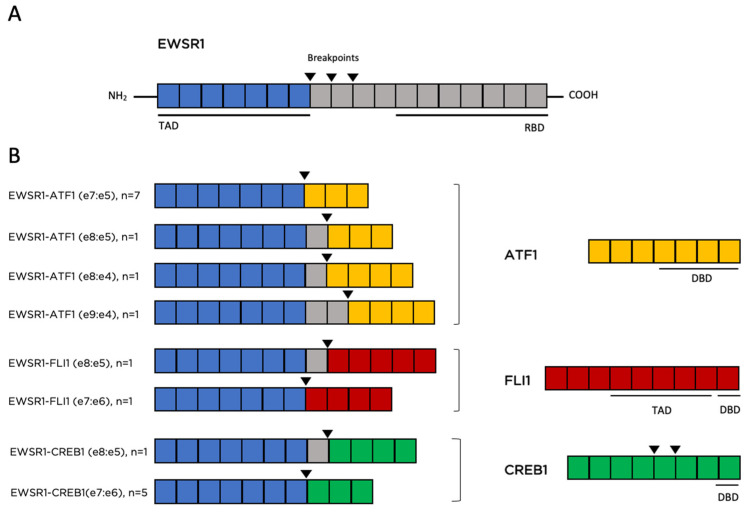
Figure 3.
Schematic representation of EWSR1 fusions identified in a cohort of 20 GNET cases profiled by next generation sequencing. (A) Schematic diagram showing EWSR1 exons and corresponding protein domains. (B) Left: predicted gene fusions. Right: schematic of partner genes (exons) and corresponding protein domains. All cases fuse the N-terminal transcriptional activation domain (TAD) of EWSR1 to a partner gene with a DNA binding domain (DBD). Black inverted triangles indicate the fusion breakpoints. Gene fusions are not drawn to scale. RDB: RNA binding domain.

