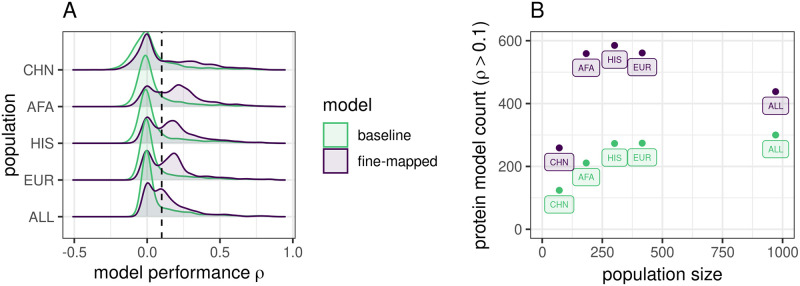
Fig 1. Protein prediction performance in TOPMed MESA populations.
A. Distributions of prediction performance across proteins within each training population between modeling strategies. ρ is the Spearman correlation between predicted and observed protein abundance in the cross-validation. Fine-mapping prior to elastic net modeling produces more significant (ρ > 0.1, vertical dotted line) protein prediction models than baseline elastic net. B. Significant (ρ > 0.1, p < 0.05) protein model counts compared to population sample size colored by modeling strategy. TOPMed MESA populations: CHN, Chinese; AFA, African American; HIS, Hispanic/Latino; EUR, European; ALL, all populations combined.

