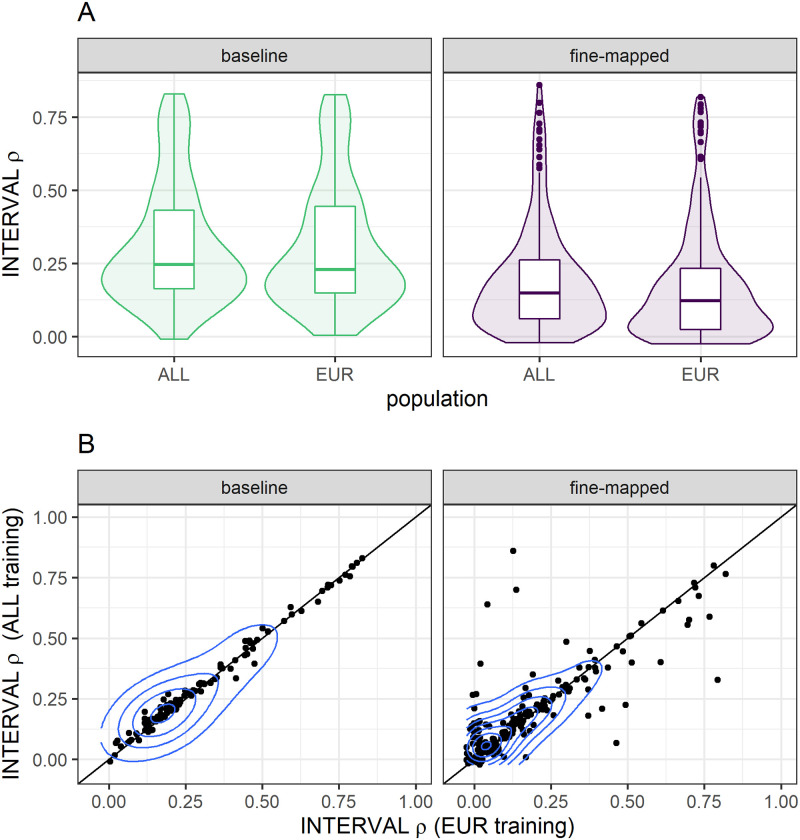
Fig 3. Protein prediction performance between training populations within each model building strategy.
We compare the performance of TOPMed MESA ALL and EUR training populations in the INTERVAL study, a European population. For each model building strategy we first take the intersection of proteins that are predicted by both training populations and then test for differences in the distributions of Spearman correlation (ρ) by a Wilcoxon signed-rank test. INTERVAL ρ was significantly higher when we used the ALL training population in both our baseline (p = 0.0012) and fine-mapped (p = 0.0064) modeling strategies. (A) The distributions of INTERVAL ρ are plotted in each training population and modeling strategy. (B) The pairwise performance comparisons between ALL and EUR training populations are shown, each point represents a protein. The blue contour lines from two-dimensional kernel density estimation help visualize where the points are concentrated.

