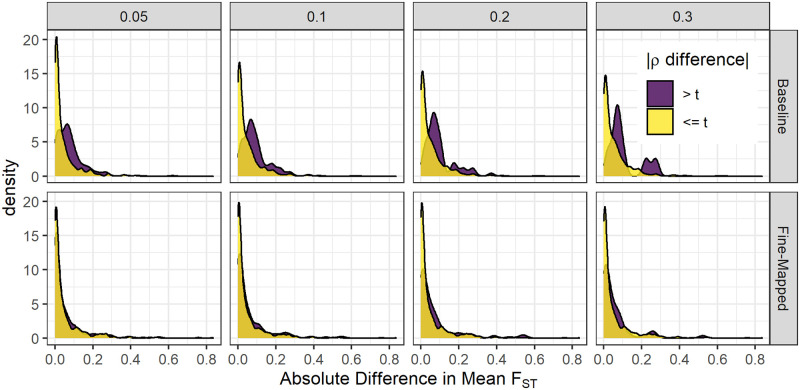
Fig 4. Allele frequency differences lead to protein predictive performance differences between populations.
Comparison of mean FST differences between protein models with large (>t) and small (< = t) differences in predictive performance ρ in INTERVAL. For baseline models, protein groups with the larger absolute value ρ difference between TOPMed MESA training populations had significantly larger mean FST at each difference threshold, t (Wilcoxon rank sum tests, p < 3.1 × 10⁻¹⁰). For fine-mapped models, the differences between protein groups were attenuated, but still significant when t = 0.1 (p = 0.0028) and t = 0.2 (p = 0.010).

