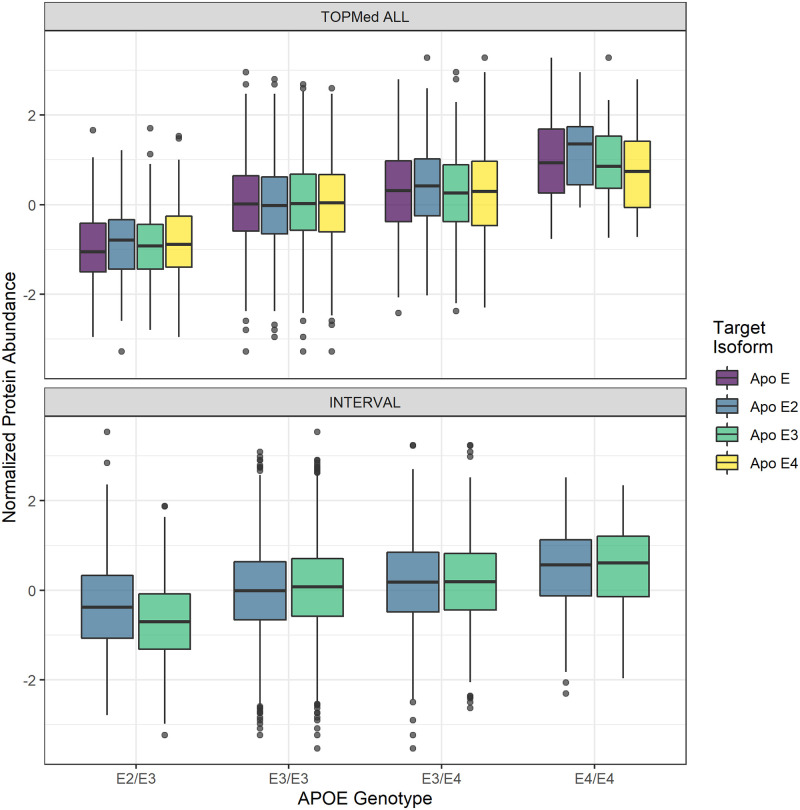
Fig 6. Distribution of adjusted protein abundance.
We observe a linear association between APOE genotype and mean abundance of each Apo E isoform. Note that within a genotype, the target isoforms from the SOMAscan assay do not vary, indicating epitope cross-reactivity effects are likely. Top: Association in TOPMed ALL β = 0.498, p = 4.60 × 10⁻²⁷. Bottom: Association in INTERVAL β = 0.295, p = 1.98 × 10⁻³⁵. Only two isoforms were available in the INTERVAL dataset.

