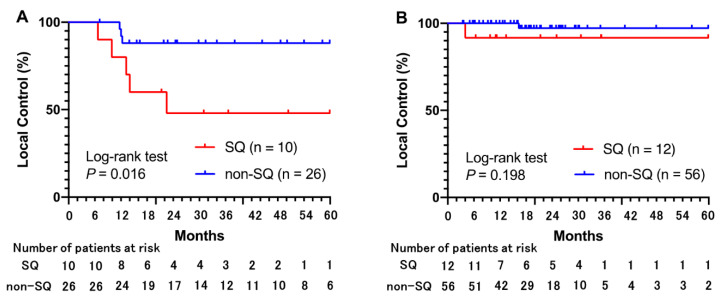
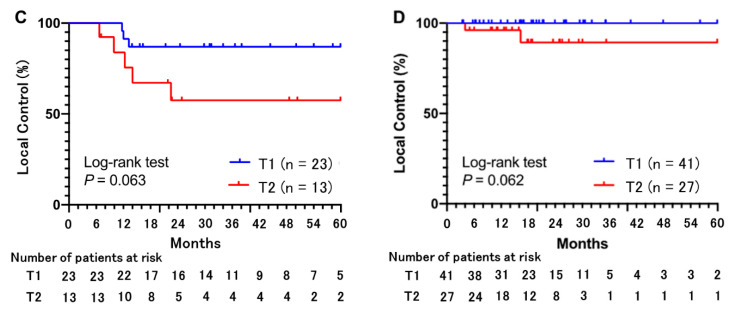
Figure 3.
Local control associated with biologically effective doses of <125 Gy and ≥125 Gy. (A) For tumors that received a PTVmax < 125 Gy (BED10), the 3-year local control (LC) rates are 48.0% for SQ and 88.0% for non-SQ. (B) For tumors that received a PTVmax ≥125 Gy (BED10), the 3-year LC rates are 91.7% for SQ and 97.2% for non-SQ. (C) For tumors that received a PTVmax < 125 Gy (BED10), the 3-year LC rates are 87.0% for clinical T1 tumors and 57.5% for clinical T2 tumors. (D) For tumors that received a PTVmax ≥ 125 Gy (BED10), the 3-year LC rates are 100% for clinical T1 tumors and 89.2% for clinical T2 tumors.


