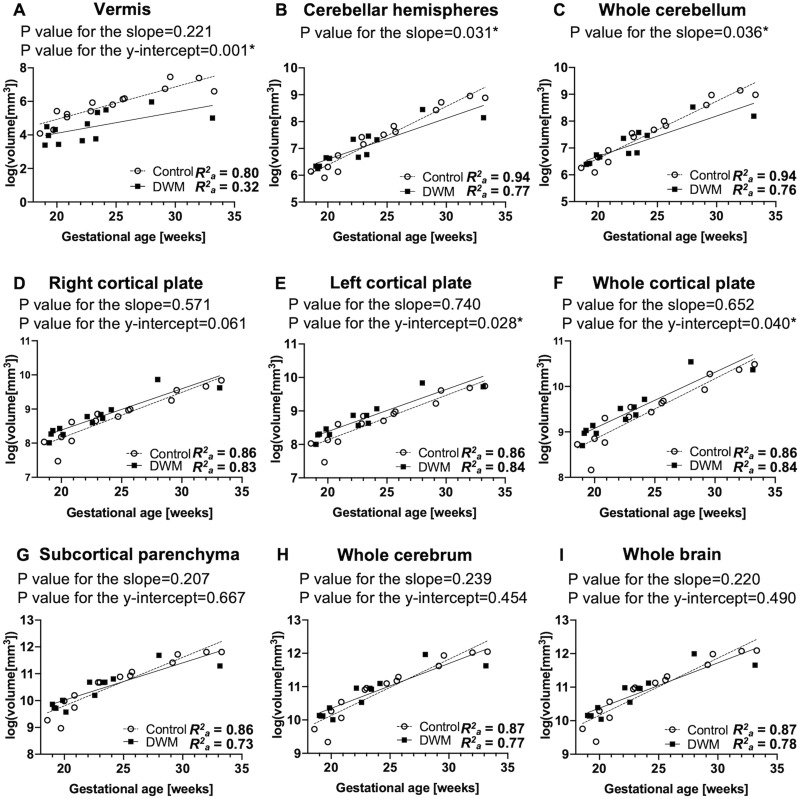
Fig 2. Regional growth trajectories in fetuses with DWM (n = 12) and control fetuses (n = 14).
Growth patterns of each regional volume were modeled and compared between fetuses with DWM and control fetuses. A logarithmic transformation of the volume data was performed before fitting the linear regression model in both the DWM and control groups. The growth trajectory of the vermis (A) was significantly smaller in fetuses with DWM than in control fetuses. Fetuses with DWM exhibited reduced rate of growth in the cerebellar hemispheres (B) and whole cerebellum (C) compared to controls. In contrast, growth trajectories of the left cortical plate (E) and whole cortical plate (F) were significantly larger in fetuses with DWM than in control fetuses. No significant differences were observed between fetuses with DWM and control fetuses in growth patterns of the right cortical plate (D), whole subcortical parenchyma (G), whole cerebrum (H), and whole brain (I).

