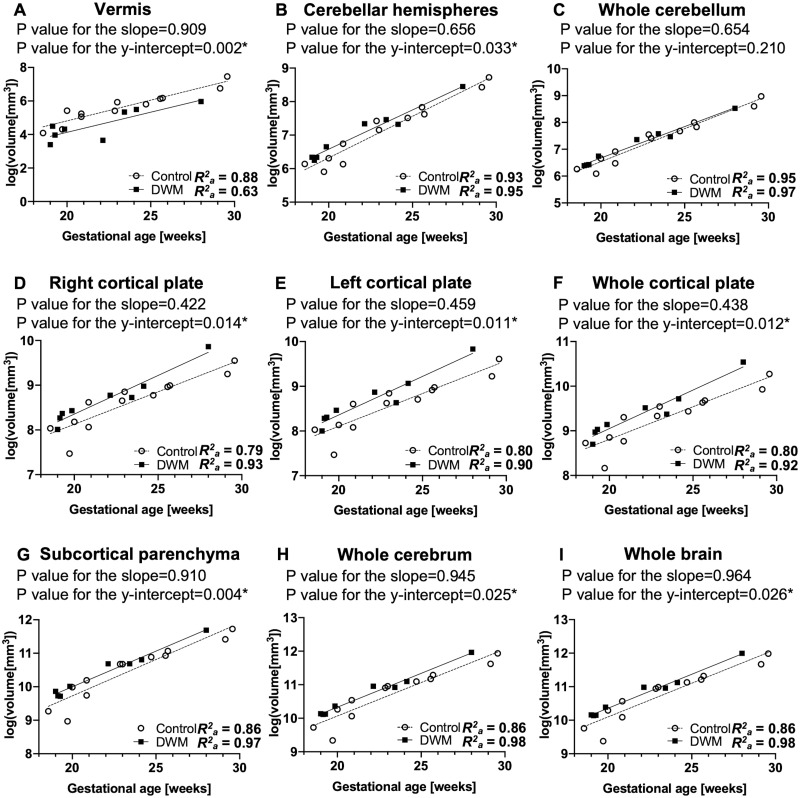
Fig 3. Regional growth trajectories in fetuses with DWM (n = 8) and control fetuses (n = 12) in subgroup analysis that excluded fetuses with agenesis of the corpus callosum (ACC).
A logarithmic transformation of the volume data was performed before fitting the linear regression model in both the DWM and control groups. Similar to results of the whole-group analysis (Fig 2), the growth trajectory of the whole cortical plate (F) was significantly larger in fetuses with DWM than in control fetuses. In the subgroup analysis, both the right (D) and left (E) cortical plate were significantly larger in fetuses with DWM than in control fetuses. Further, the growth trajectories of the cerebellar hemispheres (B), subcortical parenchyma (G), whole cerebrum (H), and whole brain (I) were significantly larger in fetuses with DWM than in control fetuses. No significant differences were observed in growth trajectories of the whole cerebellum (C) between fetuses with DWM and control fetuses in the subgroup analysis.

