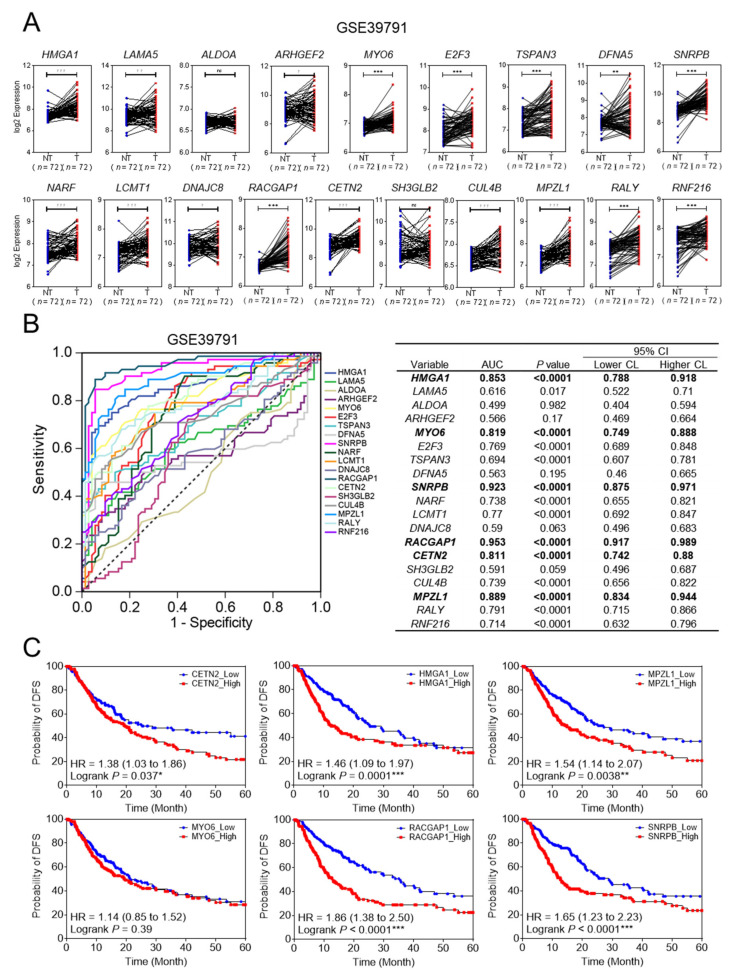
Figure 3.
Validation of the final five recurrence-related genes in patients with HCC using GEO database and TCGA data. (A) Gene expression data shows the relative expression of the 19 genes in the GEO database (GSE39791). (Welch’s t-test; * p < 0.05, ** p < 0.01, *** p < 0.001) (B) Receiving operating curves of the 19 genes with area under the curve (AUC) > 0.8 for predicting HCC recurrence in the GEO database (GSE39791). (C) Kaplan–Meier survival analysis of disease-free survival based on the expression of six genes in the TCGA_LIHC database. Hazard ratios (HR) with 95% confidence intervals and p values were calculated using the log-rank test, * p < 0.05, ** p < 0.01, *** p < 0.001.

