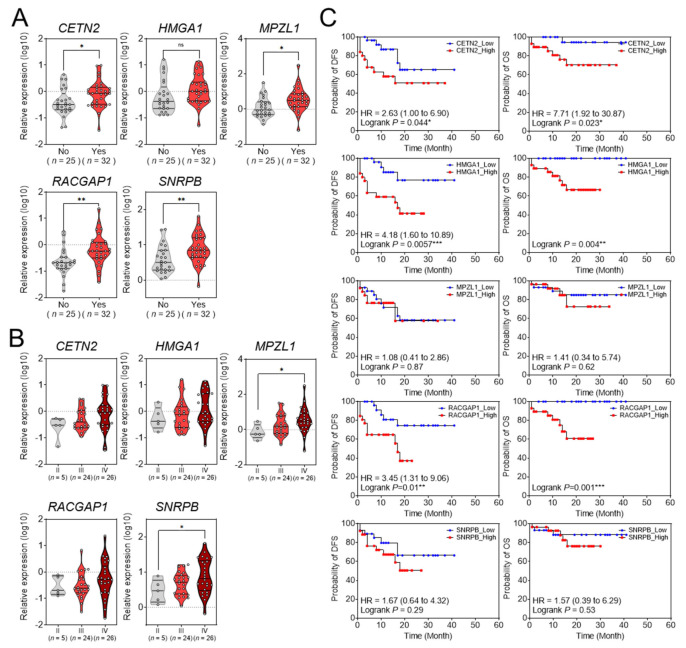
Figure 5.
The relationship between gene expression and clinicopathological characteristics. (A) Relative gene expression in HCC tissues with or without vascular invasion. * p < 0.05, ** p < 0.01, *** p < 0.001. (B) Relative expression of the five genes according to the modified UICC stage in the validation set. * p < 0.05. (C) Kaplan−Meier survival curve of overall survival and disease−free survival based on the expression levels of the five genes in the validation set.

