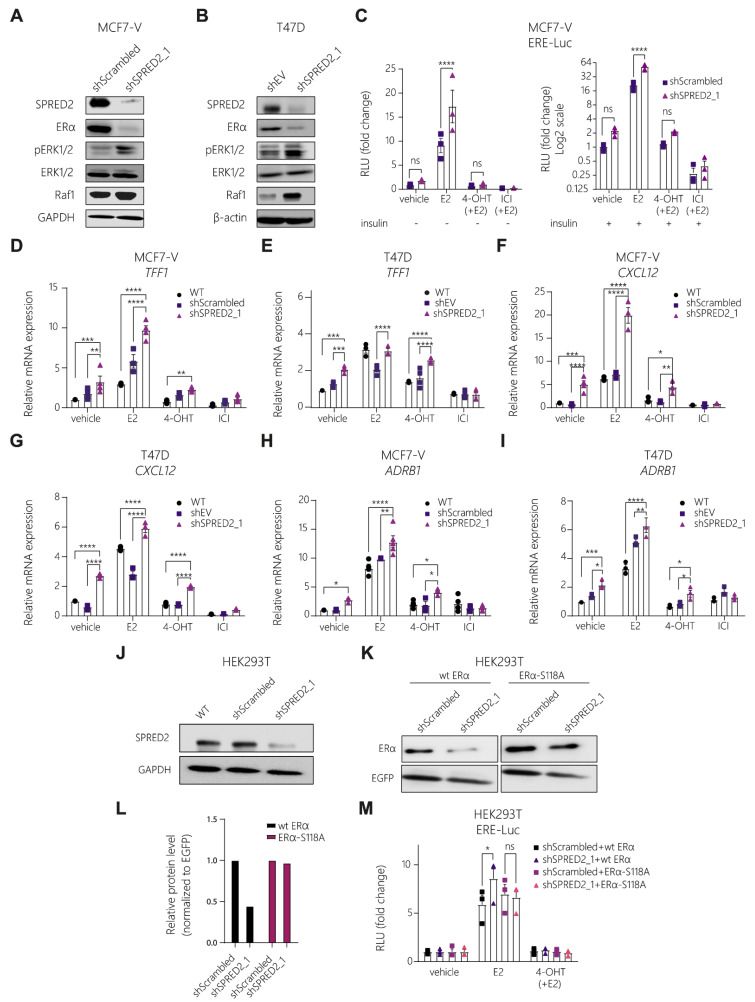
Figure 3.
Knockdown of SPRED2 stimulates ERα transcriptional activity by increasing the activity of the MAPKs ERK1/2. (A,B) Immunoblots for the indicated proteins of MCF7-V (A) and T47D (B) SPRED2 knockdown and control cells. (C) Luciferase reporter assays for endogenous ERα activity with MCF7-V cells transiently transfected with the ERE-Luc reporter plasmid. The relative luciferase activities (RLU) are relative to the activities of the internal transfection standard Renilla luciferase and the vehicle-treated shScrambled control samples set to 1. Graphs are based on n = 3 independent experiments. (D–I) Expression of ERα target genes in MCF7-V and T47D cells; mRNA levels were analyzed by RT-qPCR following 20 h (for TFF1) and 6 h (for CXCL12 and ADRB1) of treatments as indicated. WT, parent MCF7-V cells. The data were normalized to the values of the corresponding vehicle-treated untransfected cells set to 1; n ≥ 3 independent experiments. (J) Immunoblot showing the knockdown of SPRED2 in HEK293T cells with GAPDH as internal standard. WT, non-perturbed HEK293T cells. (K) Immunoblot showing wild-type and S118A mutant ERα protein levels in HEK293T cells after transient transfection with expression vectors HEG0 and HE475, respectively, using EGFP as a transfection control. (L) Quantification of the immunoblot shown in panel (K). Protein levels are normalized to the levels of co-expressed EGFP and shown relative to those of shScrambled-expressing cells. Protein levels were analyzed with ImageJ. (M) Luciferase reporter assays for exogenous ERα activity with HEK293T cells; wild-type (wt) ERα and the ERα point mutant S118A were expressed from plasmids HEG0 and HE457, respectively. The relative luciferase activities (RLU) are relative to the activities of the internal transfection standard Renilla luciferase and the vehicle-treated samples set to 1. Graphs are based on n = 3 independent experiments. Immunoblot images of panels (A,B,J,K) are representative images. In bar graphs, all error bars represent the standard errors of the means (mean ± SEM). Asterisks indicate significant differences (ns for p > 0.05, * p ≤ 0.05, ** p ≤ 0.01, *** p ≤ 0.001 and **** p ≤ 0.0001). Statistical significance was determined with a two-tailed unpaired t-test (C) and a two-way ANOVA with Bonferroni multiple comparison test for all other panels. Uncropped images of immunoblots with molecular weight standards are in Figure S5.

