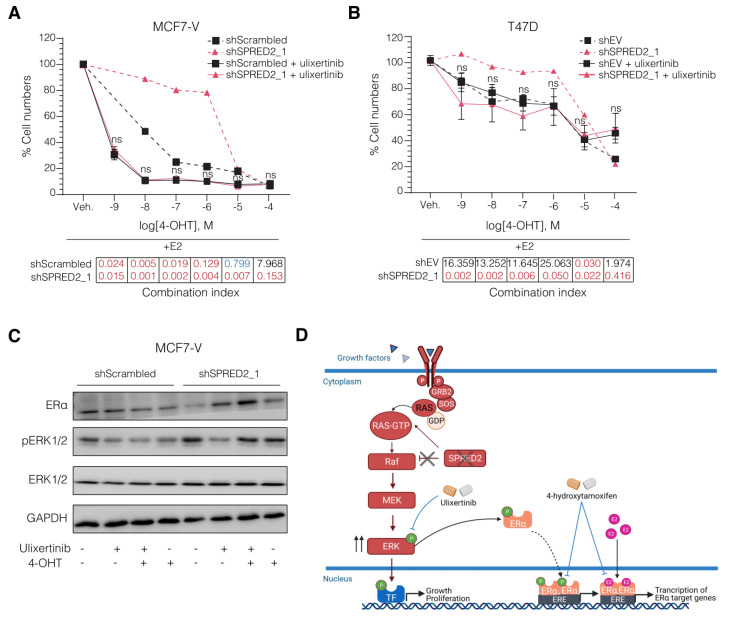
Figure 4.
Ulixertinib resensitizes SPRED2-deficient BC cells to 4-OHT. (A,B) Dose–response curves with increasing doses of 4-OHT in combination with ulixertinib at 100 nM for MCF7-V (A) and 300 nM for T47D (B). The dashed curves indicate the response to 4-OHT without ulixertinib, copied from Figure 2G,I for comparison. Statistical significance was determined with a two-way ANOVA with Bonferroni multiple comparison test for both panels. All error bars represent the standard errors of the means (mean ± SEM). Significance is indicated compared to the shScrambled (MCF7-V) or shEV (T47D) samples, each treated with ulixertinib (ns for p > 0.05). Tables below the curves indicate the combination index of 4-OHT with ulixertinib for each dose, categorized as very strong synergism (red), moderate synergism (blue), and strong antagonism (black), calculated by the Chou-Talalay method with the software CompuSyn. (C) Representative immunoblots showing the changes in ERα and p-ERK protein levels of MCF7-V cells after treatment with 4-OHT and ulixertinib alone or in combination. (D) Schematic representation of the proposed mechanism driving 4-OHT resistance in SPRED2 deficiency and how to overcome it. The illustration was created with BioRender.com. Uncropped images of immunoblots with molecular weight standards are available in Figure S5.

