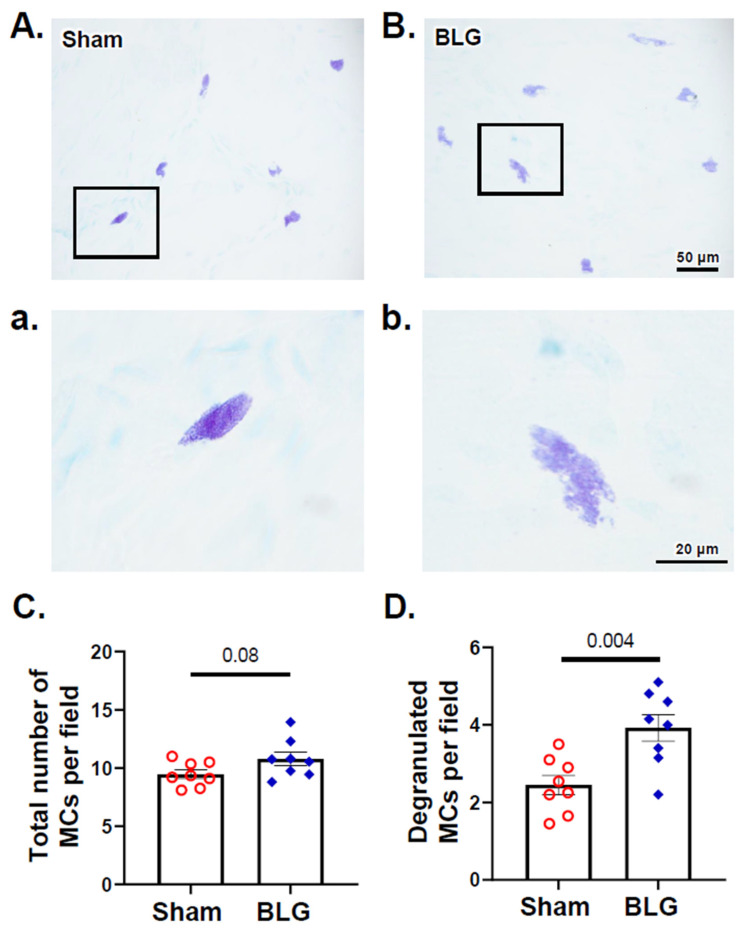
Figure 7.
Histological detection and quantification of dural MCs identified with acidic toluidine blue staining. Metachromatically stained MCs in the dura mater from the sham (A) and BLG-sensitized (B) mice were identified using light microscopy and photographed using a 40× objective. Higher magnification images of MCs (a,b) were captured using a 100× objective. Scale bars: 50 µm (for (A,B)) and 20 µm (for (a,b)). The number of total MCs (C) and the percentage of degranulated MCs (D) were quantified from the toluidine blue-stained dural tissues collected from the sham and BLG-sensitized mice. Each bar indicates the group average ± SEM (n = 8 per group). Red open circles and blue diamonds represent individual values for the sham and BLG mice, respectively. The numbers between the two bars indicate the p-values. Statistical significance (p < 0.05) was determined using Student’s t-test.

