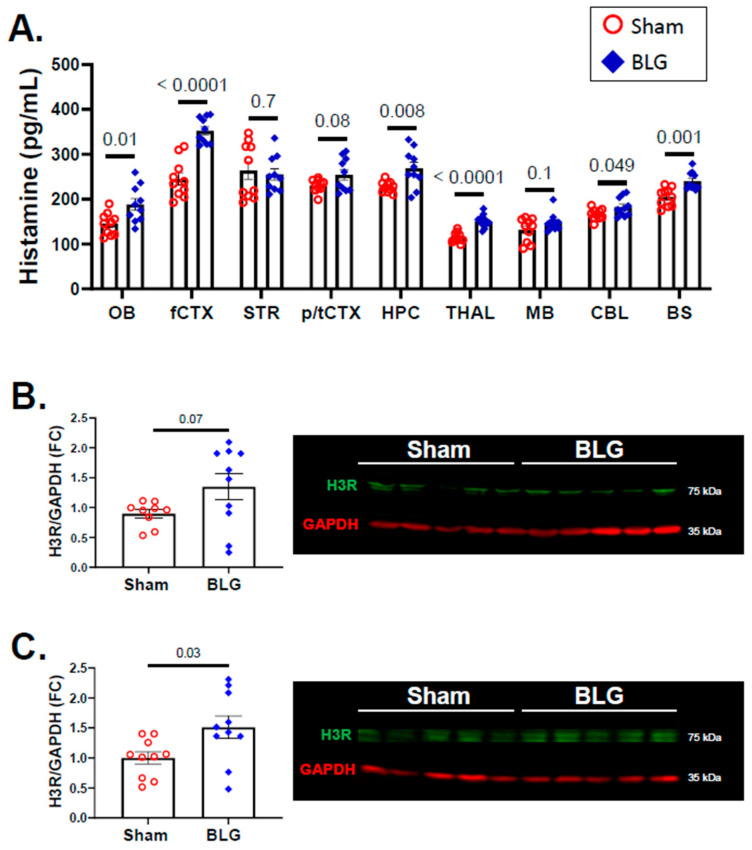
Figure 10.
Quantitation of histamine and H3R in the brain. The histamine levels in different regions of the sham and BLG-sensitized mouse brains were quantified using ELISA (A). H3R levels from the frontal cortex (B) and the parietotemporal cortex (C) were quantified using western blotting. The fluorescence signals from the H3R bands (green bands at 65 kDa) were normalized to GAPDH (red bands at 35 kDa) in the corresponding lanes and expressed as fold change (FC) calculated from the average value of the sham mice. Each bar indicates the group average ± SEM (n = 10 per group). Red open circles and blue diamonds represent individual values for the sham and BLG mice, respectively. The numbers between the two bars indicate the p-values. Statistical significance (p < 0.05) was determined using multiple uncorrected t-tests (brain region-specific histamine) or Student’s t-test (H3R expression). One outlier was removed from the sham group in the H3R western blot analysis by ROUT. OB: olfactory bulb; fCTX: frontal cortex; STR: striatum; p/tCTX: parietotemporal cortex; HPC: hippocampus; THAL: thalamic/hypothalamic region; MB: midbrain region; CBL: cerebellum; BS: brainstem.

