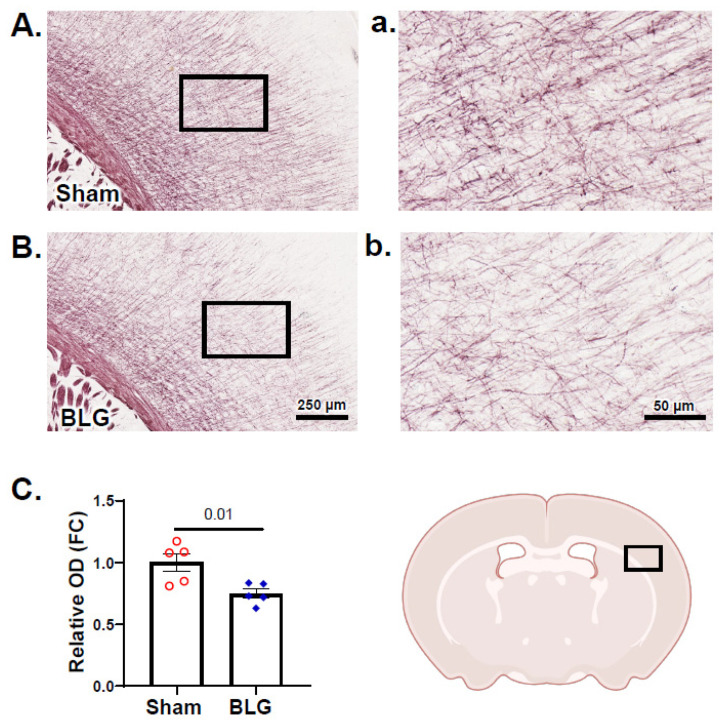
Figure 13.
Histochemical evaluation and densitometric quantitation of Black Gold II myelin staining. Brain sections from the sham (A,a) and BLG-sensitized (B,b) mice were stained for myelin using Black Gold II. Photomicrographs were taken from the cerebral cortex at the level of the caudal striatum with 10× (A,B) and 40× (a,b) objectives. Scale bars: 250 µm (for (A,B)); 50 µm (for (a,b)). The rectangle in the brain diagram in the lower right indicates the approximate location where the photomicrographs were taken. The optical density (OD) of the staining was quantified using the QuPath software (C) and expressed as fold change (FC) calculated from the relative OD value of the sham mice. Each bar indicates the group average ± SEM (n = 5 per group). Red open circles and blue diamonds represent individual values for the sham and BLG mice, respectively. The numbers between the two bars indicate the p-values. Statistical significance (p < 0.05) was determined using Student’s t-test.

