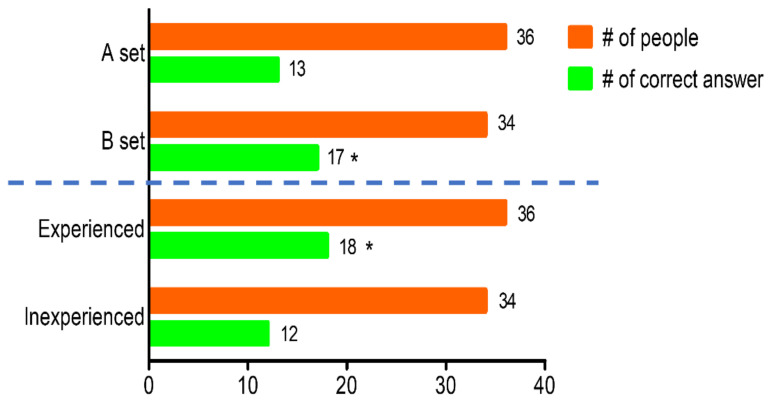
Figure 4.
The number (#) of people who chose one sample as different from the other samples, and total number in each group. The data was collected by triangle test of cabbage juice made of cabbage grown under OF and APV (n = 70). Set A contained 2 OF samples and 1 APV sample, while set B had 2 APV samples and 1 OF sample. Asterisk (*) indicates significant differences by chi-square test (p < 0.05) between the total and the number of correct respondents.

