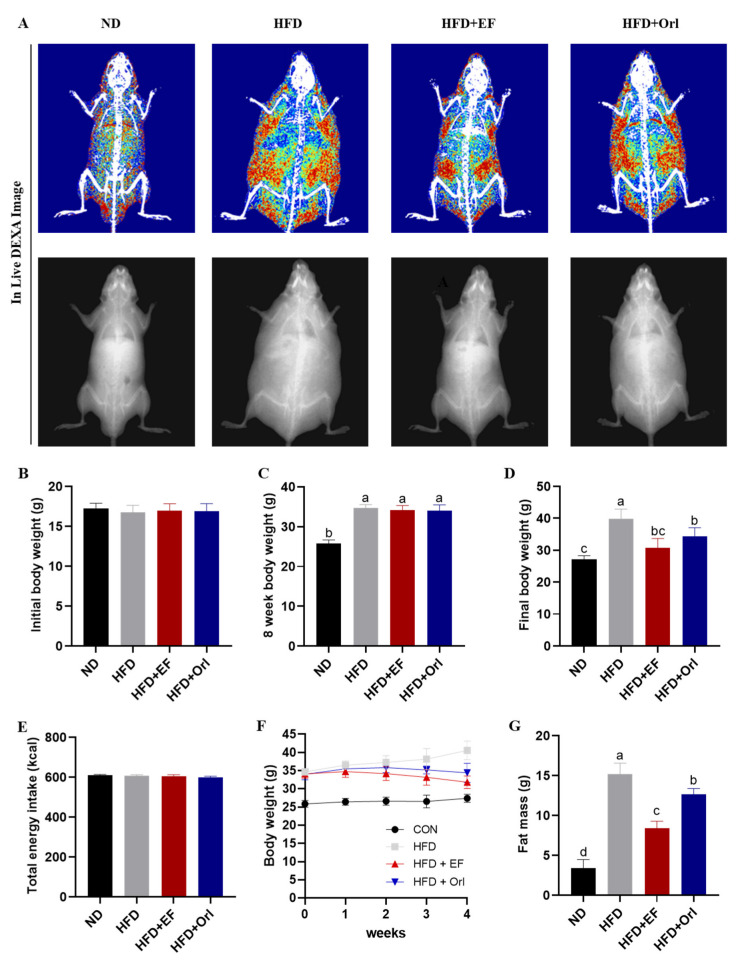
Figure 1.
The effect of EF-2001 on growth performance of DIO mice. (A) The radiography of body fat. (B) Initial body weight. (C) Eight-week body weight. (D) Final body weight. (E) Total energy intake. (F) The trend of body weight change of mice in each group. (G) Fat mass. Dunnett’s multiple range tests revealed significant differences in a–d values with different superscripts at p < 0.05. Data are expressed as mean ± SEM.

