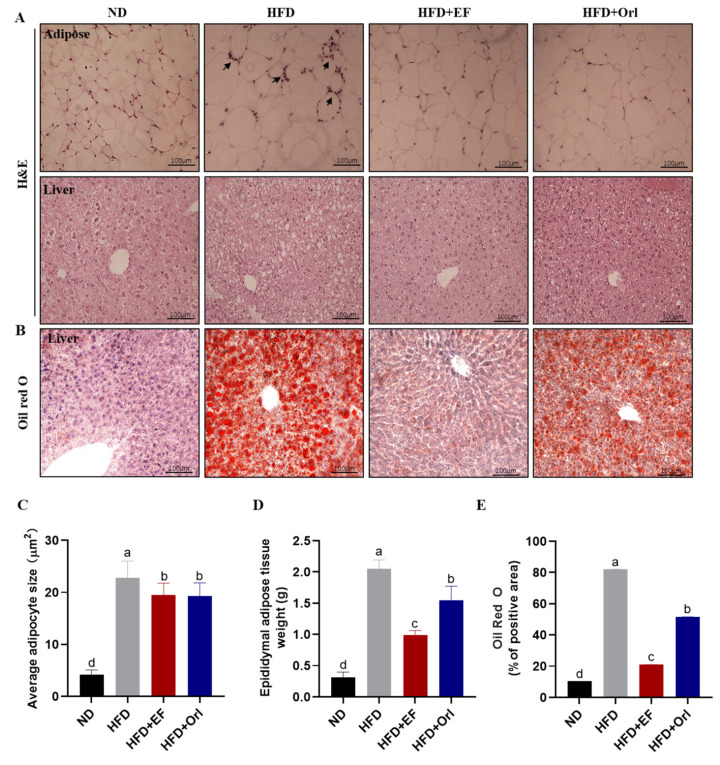
Figure 2.
The effect of EF-2001 on liver and adipose histopathology. (A) Representative microscopic observation of adipose tissue of epididymis and liver tissue by H&E staining. Arrows mark the inflammatory cells. (B) Representative microscopic observation of liver tissue by oil red O staining. (C) Mean adipocyte area (μm2). (D) Epididymal adipose tissue weight (g). (E) Mean Oil Red O staining in hepatocytes area (μm2). Dunnett’s multiple range tests revealed significant differences in a–d values with different superscripts at p < 0.05. Data are expressed as mean ± SEM.

