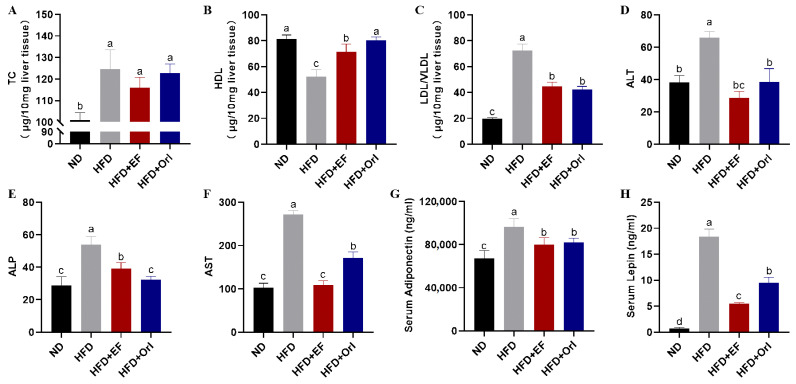
Figure 3.
The effect of EF-2001 on liver and blood biochemical parameters. (A) Total cholesterol (TC) content of liver tissue. (B) High-density lipoproteins (HDL) content of liver tissue. (C) Low-density lipoproteins and very low-density lipoproteins (LDL/VLDL) content of liver tissue. (D) Serum alanine aminotransferase (ALT). (E) Serum alkaline phosphatase (ALP). (F) Serum aspartate aminotransferase (AST). (G) Serum adiponectin. (H) Serum leptin. Dunnett’s multiple range tests revealed significant differences in a–d values with different superscripts at p < 0.05. Data are expressed as mean ± SEM.

