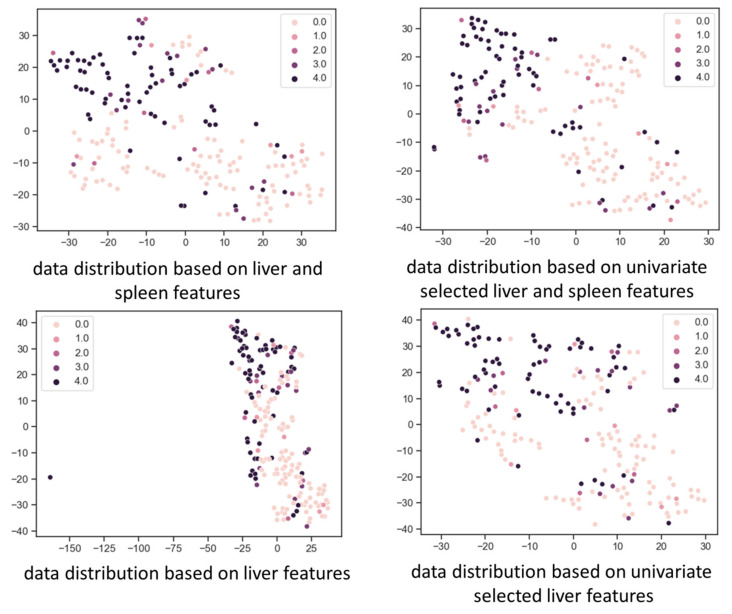
Figure 3.
Data distribution based on radiomic features after dimension reduction using the t-distributed stochastic neighbor embedding (t-SNE) method. Features are reduced to two dimensions represented by the two axes. Each dot represents a computed tomography (CT) scan, and its color represents the liver fibrosis stage as shown at the upper corner of the graph. A relative clustering of different fibrosis stages is observed, which means that CT scans of different fibrosis stages can be differentiated based on the two-dimensional features after dimension reduction.

