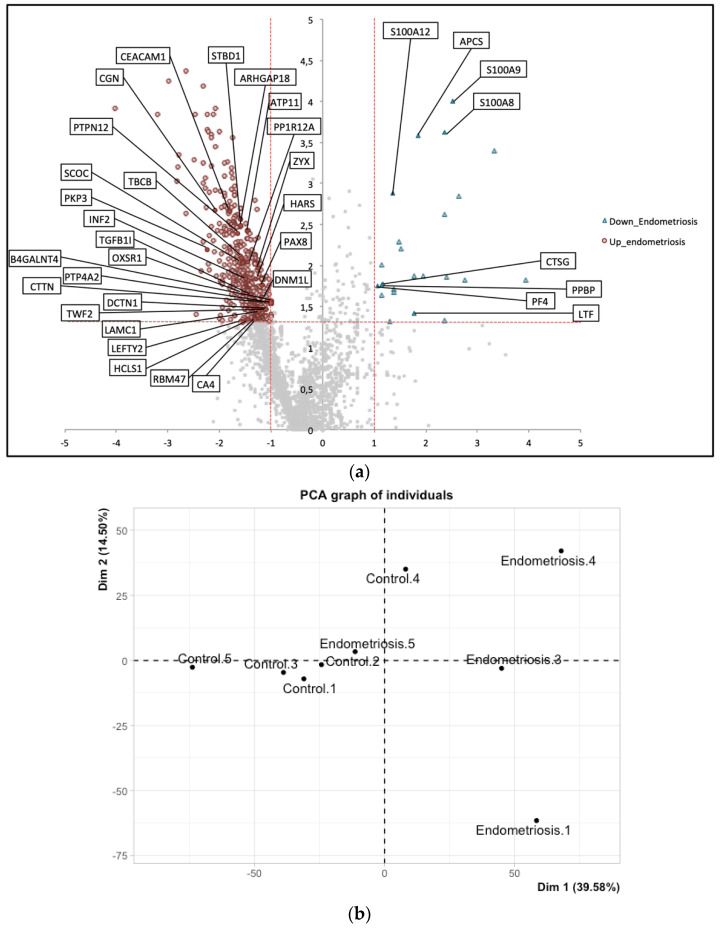
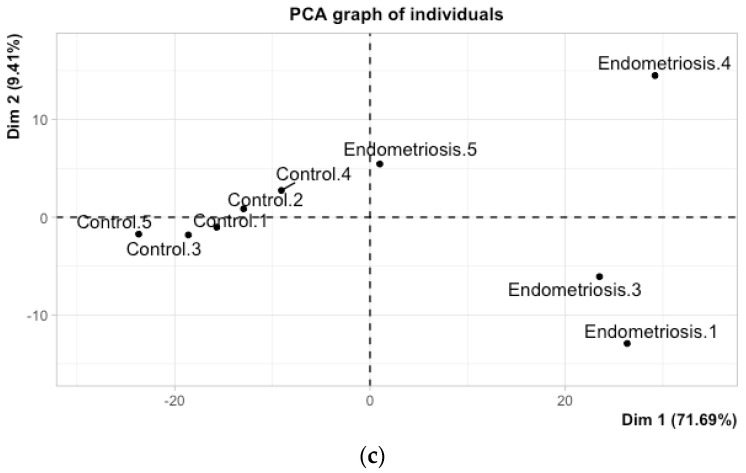
Figure 1.
(a) Volcano plots illustrate differentially abundant proteins between the eutopic endometrium from control and endometriosis patients. The log10 (binomial p-value) is plotted against the log Ratio. The non-axial vertical lines denote a ± two-fold change while the non-axial horizontal line denotes p ≥ 1.3, which was our significance threshold (prior to logarithmic transformation). Proteins upregulated with a fold change ≥ 2 and p < 0.05 are depicted in red circles and those downregulated with a fold change ≥ 2 and p < 0.05 are shown in blue triangles. The proteins shown in grey were not found to differ significantly between the eutopic endometrium of controls and that of endometriosis patients; (b) Principal Component Analysis (PCA) applied to all samples based on the expression data of all identified proteins, i.e., fives controls and four endometrioses; (c) PCA applied to all samples based on the expression data of the 543 differential proteins.


