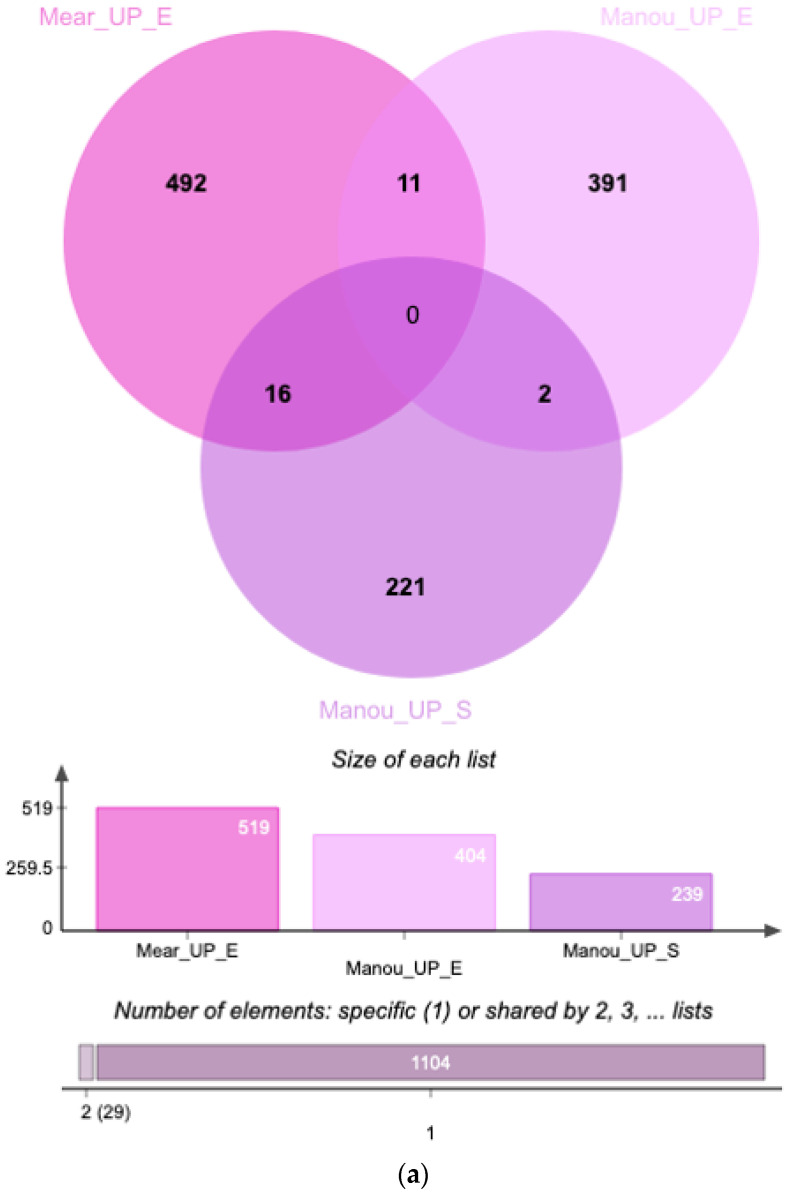
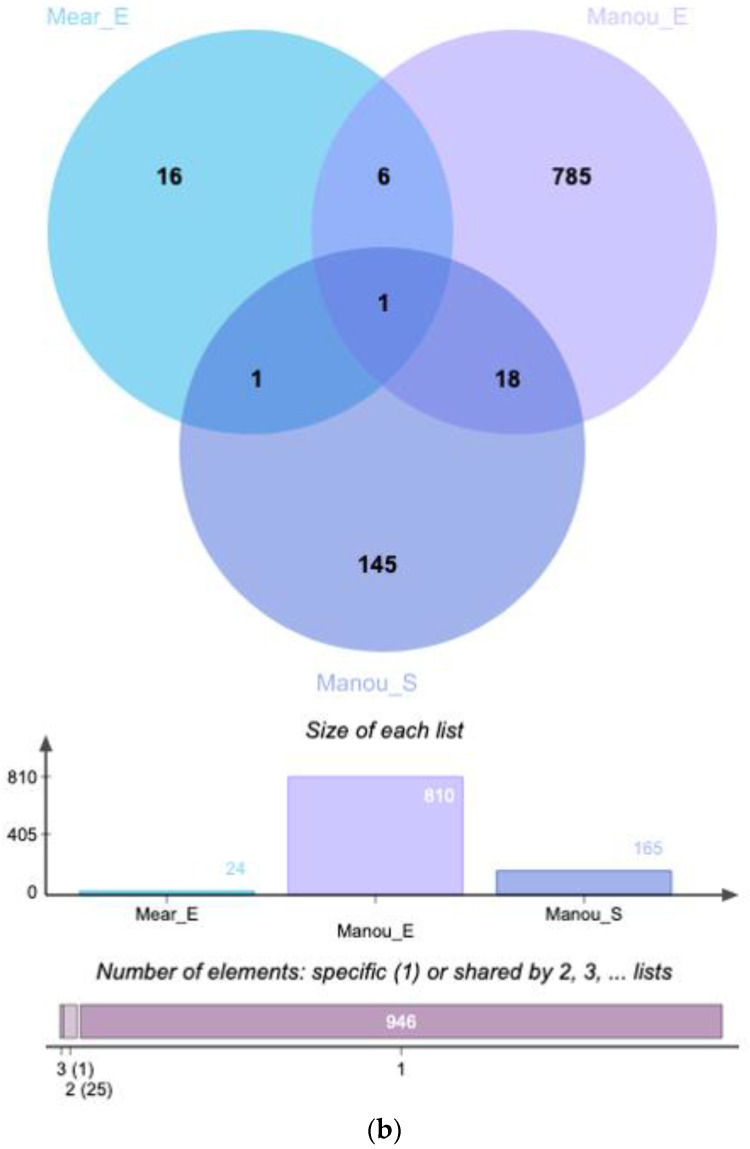
Figure 4.
Venn Diagrams (a) Upregulated proteins from our dataset (Mear_UP_E) and those of the eutopic endometrium (Manou_UP_E) and serum (Manou_UP_S) of study of Manousopoulou et al.; (b) Downregulated proteins from our dataset (Mear_E) and the eutopic endometrium (Manou_E) and serum (Manou_S) of the study of Manousopoulou et al.


