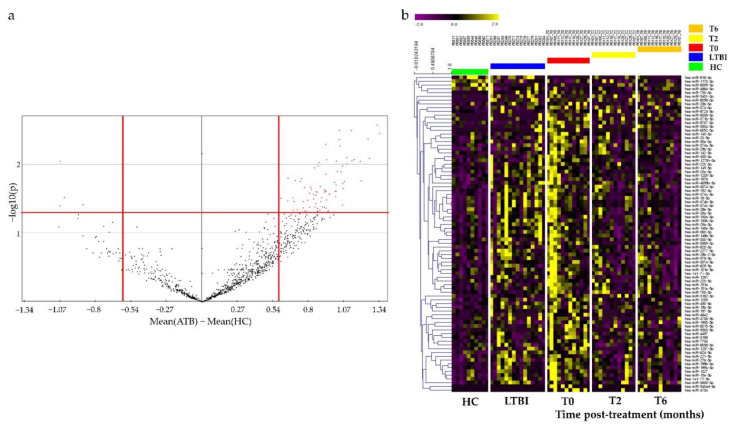
Figure 1.
Volcano plot and heat map of differentially expressed miRNAs in whole blood of patients with active tuberculosis (ATB), latent tuberculosis infection (LTBI) and healthy controls (HCs). (a) Volcano plot of miRNAs between patients with ATB and HCs. Cut-off points for the p value (<0.05; −log10(0.05) = 1.30) or mean difference (>0.5 or <−0.5) are indicated by red lines. (b) Heat map of the 84 significantly differentially expressed miRNAs for patients with ATB after two (T2) and six months of treatment (T6), LTBI, and HCs (Pearson correlation; p < 0.05 by hierarchical clustering analysis). Yellow dots represent upregulated miRNAs, and blue dots represent downregulated miRNAs.

