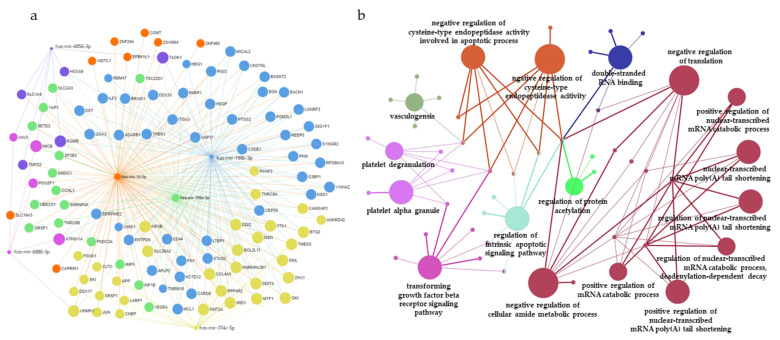
Figure 4.
miRNA–mRNA interaction network analysis and gene ontology (GO) enrichment analysis of target genes. (a) The top six miRNAs were uploaded to the miRNet database and. A significant miRNA–target gene network was constructed; miR-199b-3p (blue), miR-16-5p (orange), miR-199a-3p (green), miR-374c-5p (yellow), miR-6856-3p (purple), and miR-6886-3p (pink). (b) GO enrichment analysis of target genes, with the top six differentially expressed miRNAs represented as functionally grouped networks of enriched GO terms generated by ClueGo. The parameters of ClueGO were set as follows: GO term fusion selected; only display GO terms with p < 0.05 in Bonferroni step-down analysis; kappa score of 0.4.

