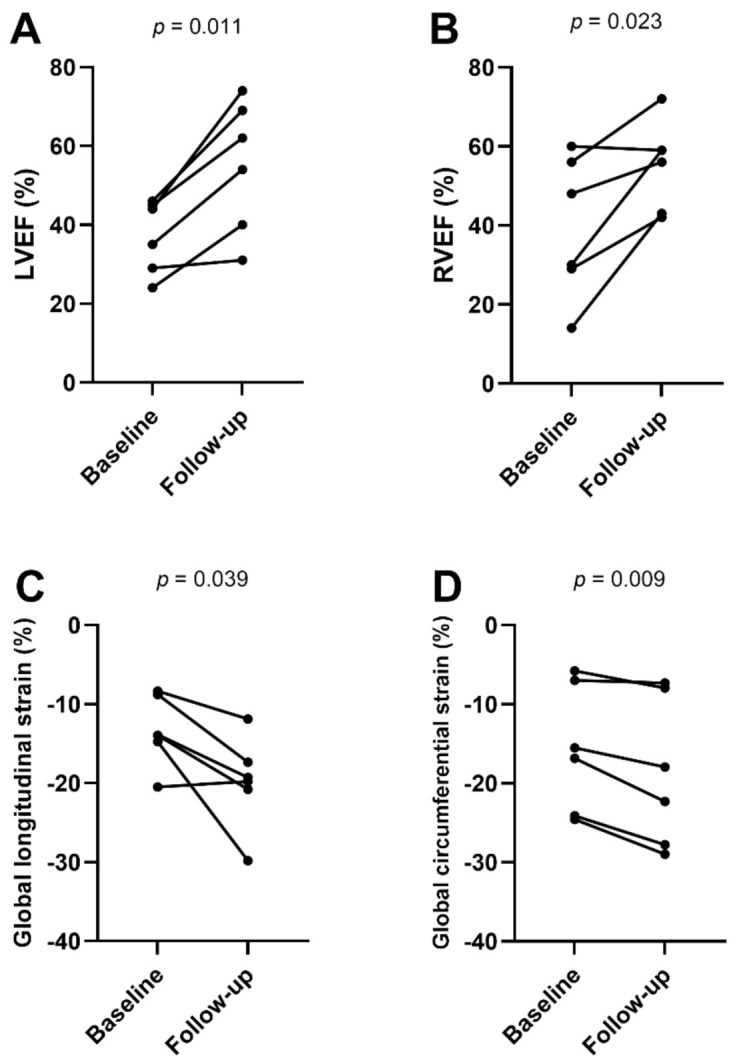
Figure 2.

Line graphs show functional cardiac magnetic resonance parameters (A–D) at baseline (n = 6) and follow-up (n = 6). Individual values are represented by the dots at baseline and follow-up MRI. The connecting lines show the tendency of change in functional parameters over time. p-Values were obtained using paired Student’s t-test. LVEF = left ventricular ejection fraction, RVEF = right ventricular ejection fraction.
