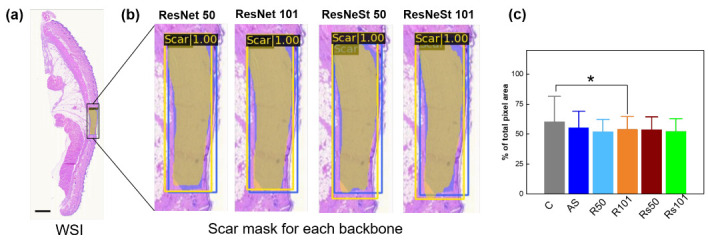
Figure 5.

Scar identification with Mask RCNN using various backbones: (a) whole slide image with scar mask in yellow color and (b) magnified images of scar area, and (c) statistical comparison of measured scar areas (in pixel numbers) between conventional and machine learning methods. Blue and red boxes in (a,b) represent annotated answers (blue) and the predicted scar areas (yellow), respectively (scale bar = 3000 µm; (c) C = conventional method; AS = annotated scar; R50 = ResNet 50; R101 = ResNet 101; Rs50 = ResNeSt 50; Rs101 = ResNeSt 101; * p < 0.05 C vs. R101).
