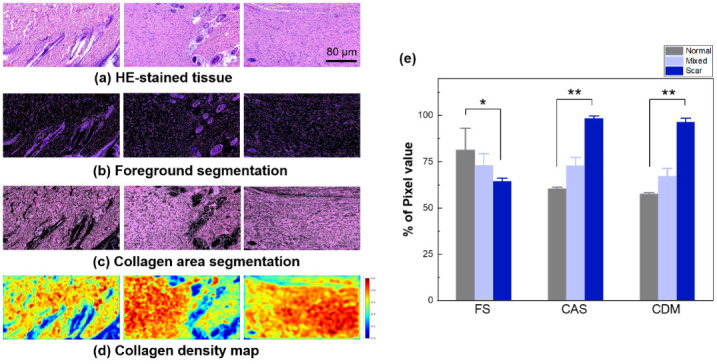
Figure 7.

Tissue analysis with color segmentation with K-means clustering: (a) original dataset (HE-stained tissue), (b) foreground segmentation (FS; HFs, Gs, and N), (c) collagen area segmentation (CAS), (d) CDM, and (e) statistical comparison of FS, CAS, and CDM (input size = 886 × 1614; scale bar = 80 µm; 16X; * p < 0.05 and ** p < 0.005 between normal and scar).
