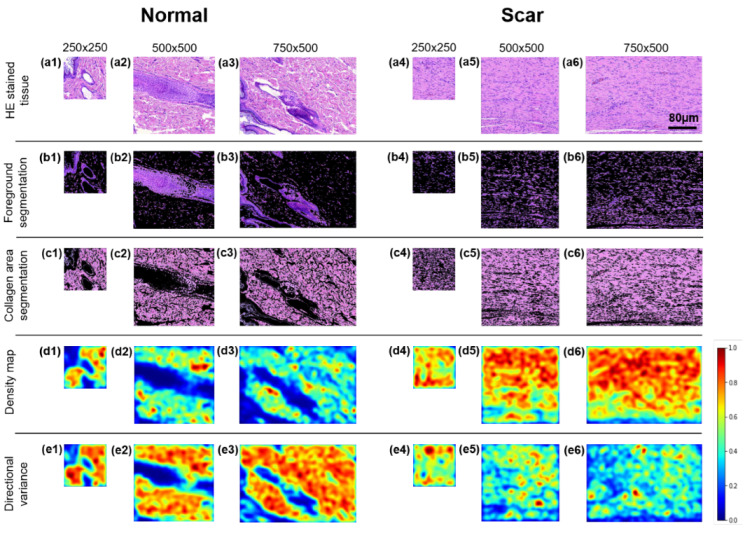
Figure 8.

Region of interest (ROI) image comparison between normal (left) and scar tissues (right) in different image sizes (250 × 250, 500 × 500, and 750 × 500 pixels): (a) HE-stained tissue (a1–a3 for normal and a4–a6 for scar), (b) FS (b1–b6), (c) CAS (c1–c6), (d) CDM (d1–d6), and (e) directional variance map (e1–e6).
