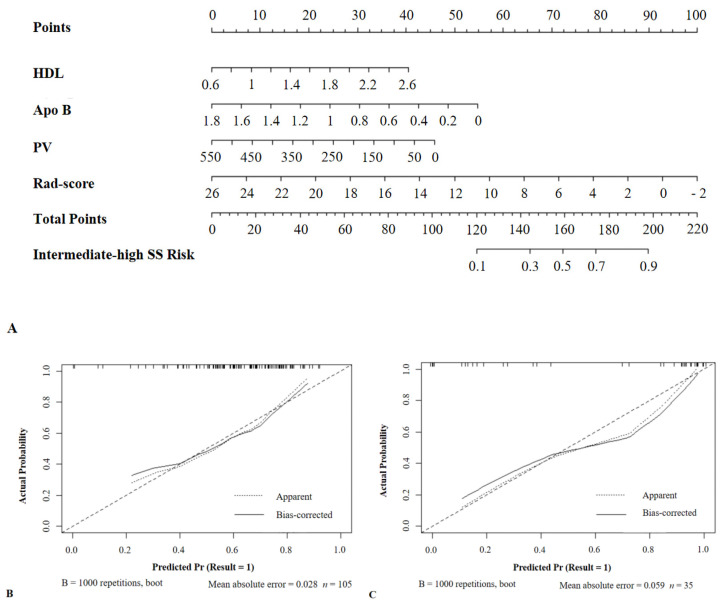
Figure 6.
Nomogram combining HDL, Apo B, plaque volume, and Rad-score. (A) Nomogram plot. (B) Calibration graph for the training set. (C) Calibration graph for the validation set. HDL, high-density lipoprotein; ApoB, apolipoprotein B; PV, plaque volume; SS, SYNTAX scores. Result = 1: The SS was intermediate-high.

