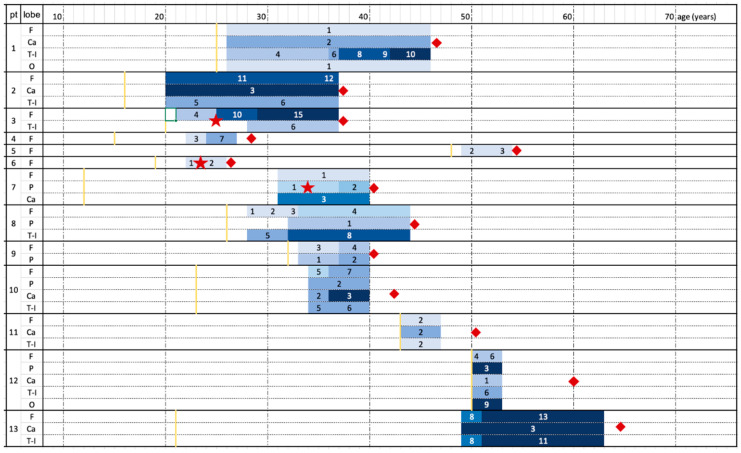
Figure 1.
Atrophy progression timeline for each patient. Patients’ age (years) increases from left to right. The shades of blue represent MRI controls and worsening of the degree of atrophy (according to numerical values deriving from the sum of the scores of different areas, as mentioned in Table 2). Yellow line represents clinical onset; red squares represent patients’ last clinical evaluation and red stars the surgical intervention. Patient 10 and 13 died after last follow-up due to non-neurological disease. F = frontal lobe; Ca = Caudate nucleus; T-I = temporoinsular lobes; P = parietal lobe; O = occipital lobe.

