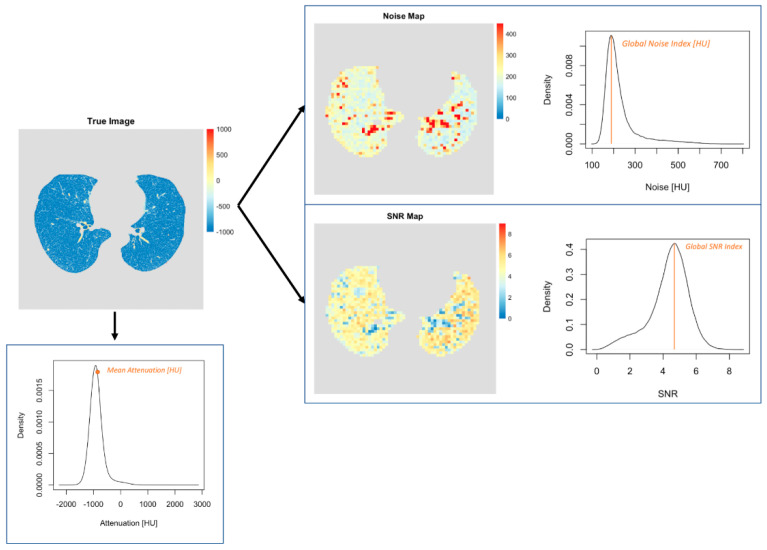
Figure 1.
Visual representation of the quantitative image analysis in patients. First, the lungs were segmented automatically from the CT image sets. Second, mean CT attenuation was measured. Third, noise and signal-to-noise ratio maps were generated. The mode values of the corresponding distributions were defined as GNI and GSNRI.

