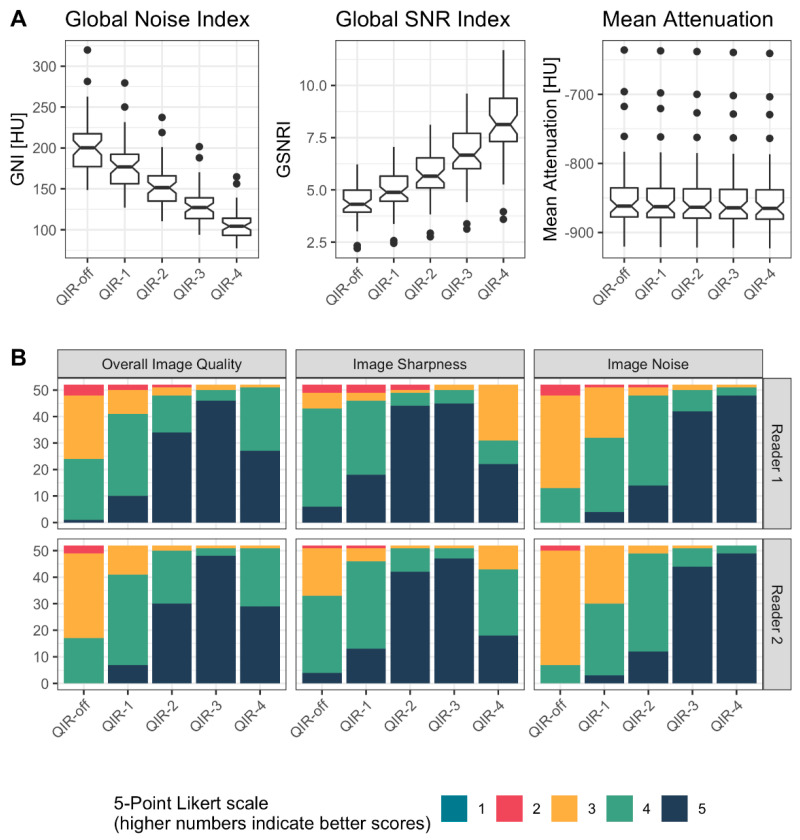
Figure 4.
Detailed overview of the results from qualitative and quantitative analysis in patients. (A) shows the results from quantitative analysis by means of notched boxplots. A linear decrease of GNI and a linear increase of GSNRI were observed with increasing level of QIR. The CT attenuation was similar among reconstructions. (B) shows the results from qualitative analysis by means of stacked bar plots. While QIR-4 achieved highest ratings for image noise, QIR-3 performed best for sharpness and overall image quality.

